Full Report
The richest corner
Allegion plc makes the hardware that controls a door: the locks, the panic bars that let a crowd out of a burning building, the closers that pull a fire door shut behind you, and — increasingly — the electronic readers and credentials that decide who may pass. It sells these under brands most people have touched without noticing: Schlage on a front door, Von Duprin on a school exit, LCN on an office closer. The company was carved out of Ingersoll Rand in 2013, incorporated in Ireland, and listed in New York; in 2025 it turned $4,067.3 million of revenue into $859.5 million of operating income [1].
That is a 21.1% operating margin [2]. Across the four listed building-products and industrial companies it is most often measured against, the median was 9.9%, and revenue at three of those four shrank in the same year Allegion's grew 7.8%. A door-hardware maker earning more than double the typical peer's margin, and gaining ground while they lost it, is the fact that makes an otherwise unglamorous company worth reading about. The chapters that follow take apart why that gap exists, whether it lasts, where the cash it produces is going, and what price the market now attaches to it. This one establishes what the company is and how far above its field it actually sits.
Revenue (FY2025)
Operating Margin
Revenue Growth YoY
Free Cash Flow Margin
Source: FY2025 Annual Report, Business Overview and MD&A [3] [4]; free cash flow margin derived from reported financials.
What it makes
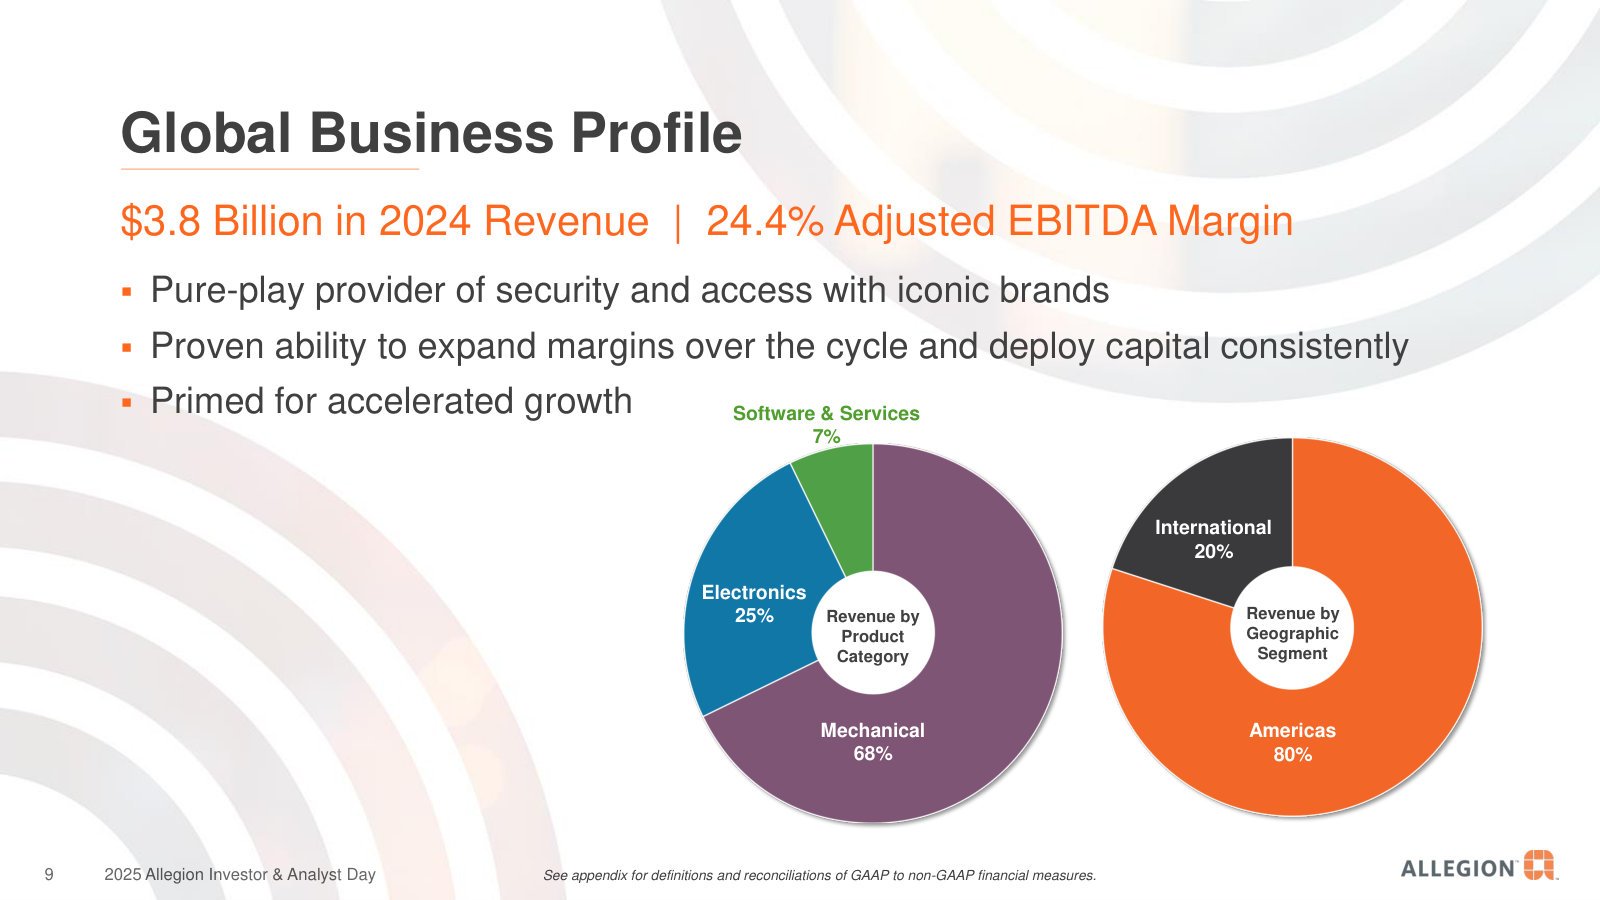
Allegion's catalogue spans more than 40 brands, but its revenue divides cleanly along one line: mechanical versus electronic. Mechanical products — the keyed locks, exit devices, closers and door systems that have defined the category for a century — were $2,713.9 million in 2025, two-thirds of the total. Electronic products, meaning electronic locks, access-control systems and workforce-credentialing software, were $1,075.1 million, about 26%, and growing faster. Services and software made up the remaining $278.3 million [5].
Source: FY2025 Annual Report (Form 10-K), Note 20 — net revenues by nature of products and services [6].
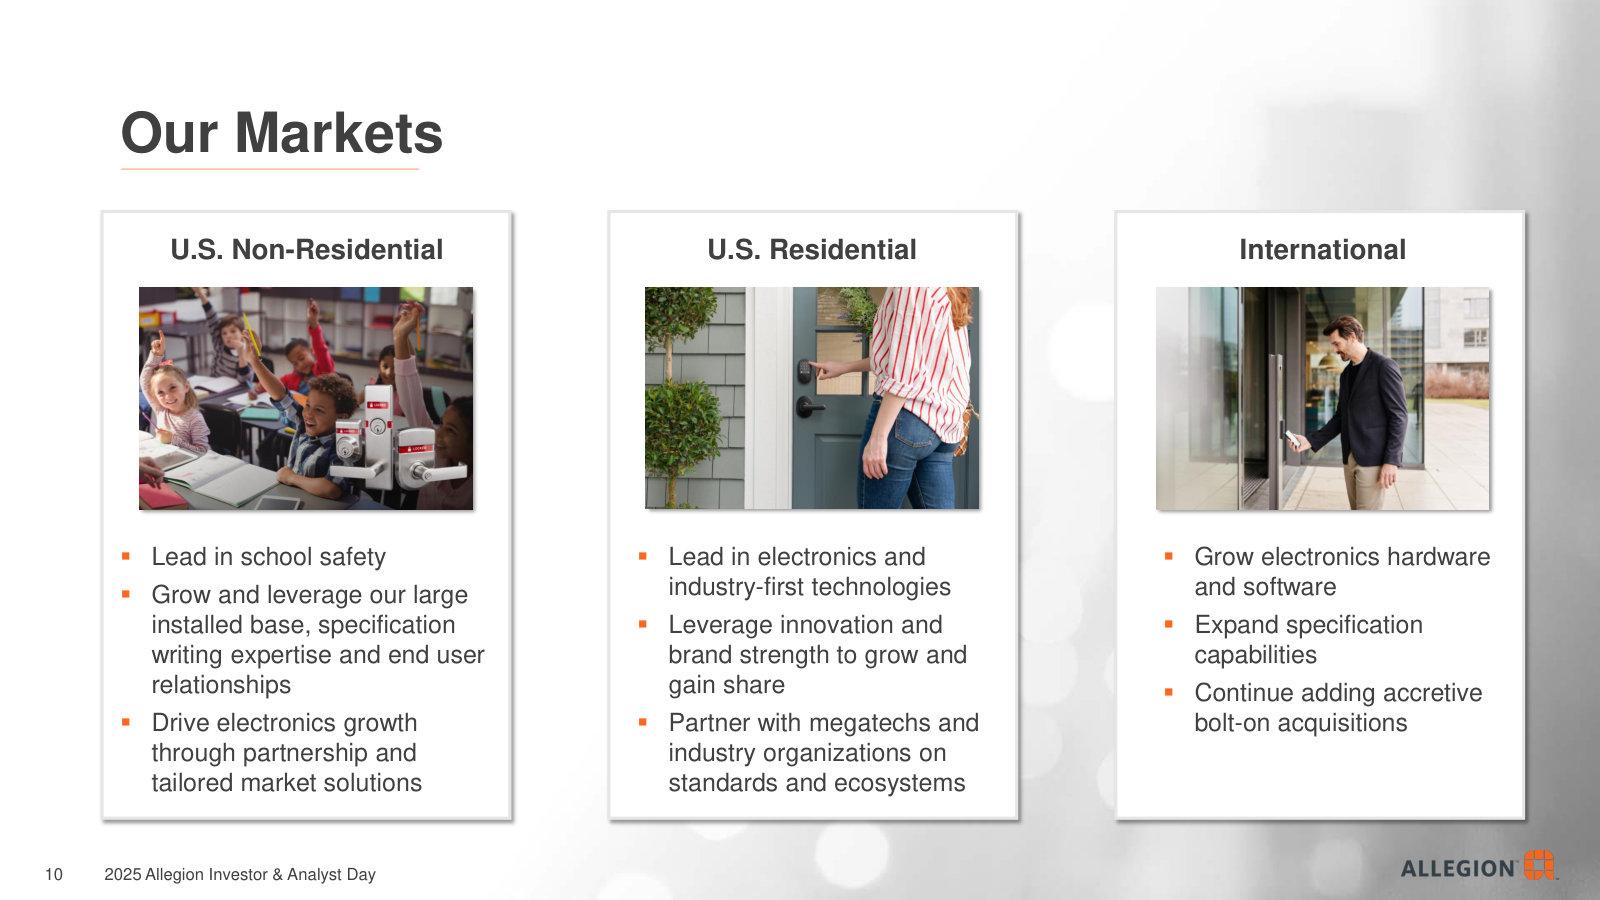
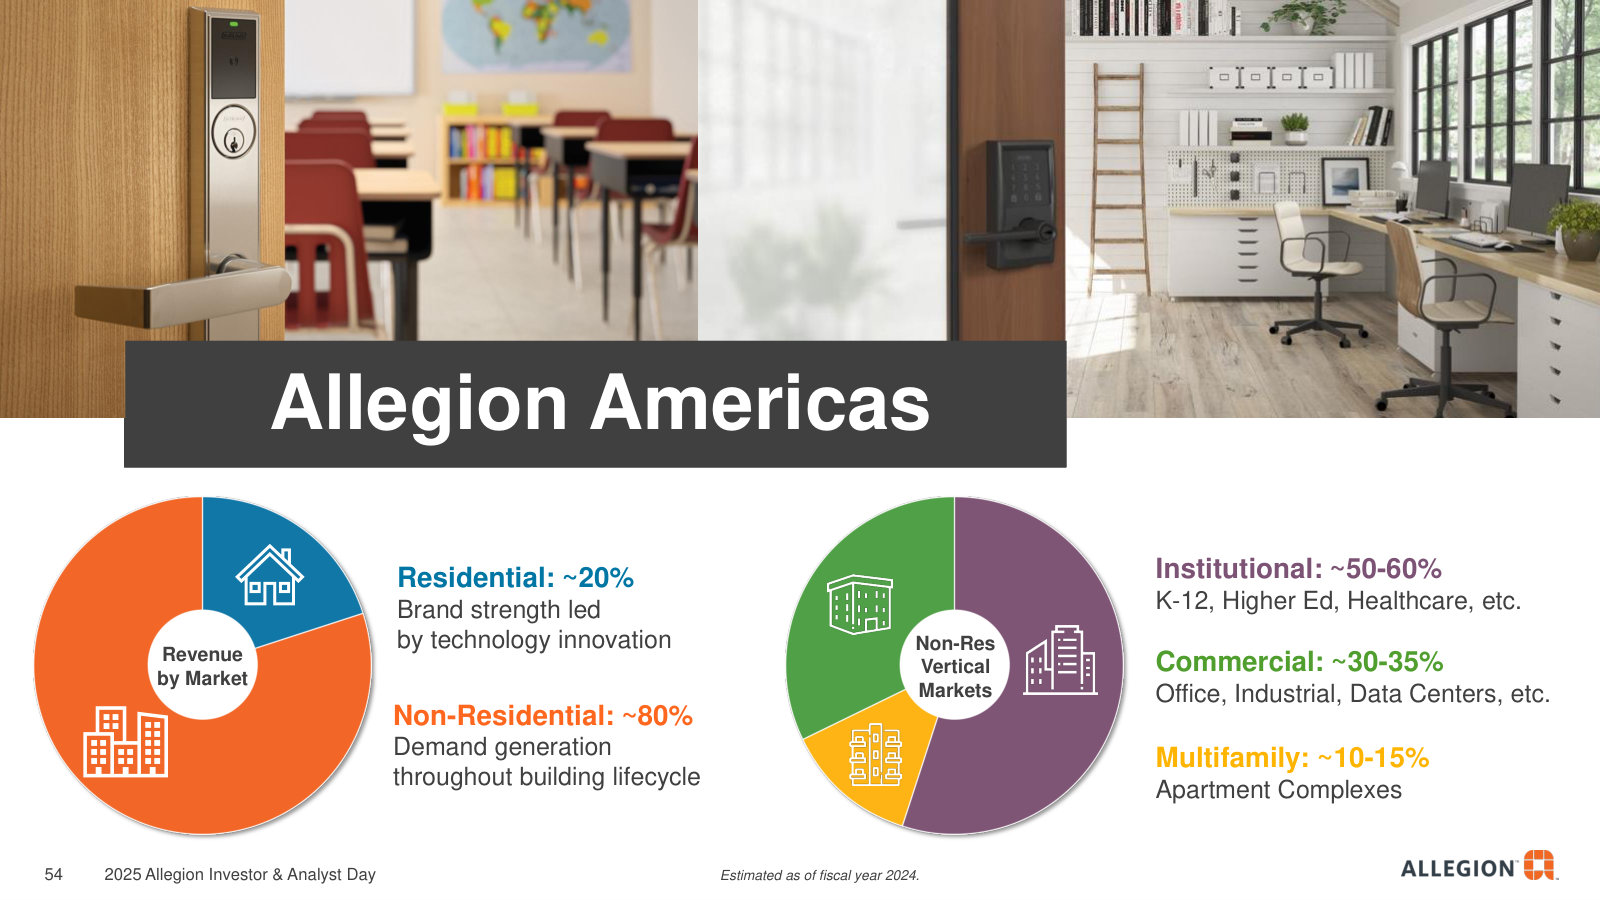
The split between commercial and residential matters as much as the split between mechanical and electronic. Roughly a quarter of revenue is a keyed lockset destined for a home; the larger share is non-residential hardware — the specification-grade product that goes into a school, hospital, airport or office. Non-residential is where the brand names carry weight and where the economics are best, and it is the demand the rest of this report keeps returning to.
Two segments, one engine
The company reports in two segments, and the gap between them is the single most important structural fact about it. Allegion Americas — the North American business built on Schlage, Von Duprin, LCN and the Stanley Access Technologies automatic-door line — booked $3,218.8 million of revenue in 2025, 79% of the total. Allegion International, spanning European and Asia-Pacific brands such as CISA, Interflex and SimonsVoss, booked the other $848.5 million [7].
Profit is far more lopsided than revenue. The Americas segment earned $896.5 million of operating income at a 27.9% margin; International earned $76.5 million at 9.0% [8]. So a fifth of revenue produces only 8% of segment profit, and the North American business — with a margin that has climbed from 26.0% to 27.9% over three years — supplies the other 92% [9].
Source: FY2025 Annual Report (Form 10-K), Review of Business Segments and Note 20 [10] [11]; profit shares derived from reported segment operating income.
Placed against the consolidated income statement, the whole model comes into focus. Cost of goods sold was 54.8% of revenue and selling and administrative expense 24.1%, leaving the 21.1% operating margin; net earnings were $643.8 million, or $7.44 per diluted share [12]. Two lines govern almost everything: how much specification-grade Americas hardware ships, and what it costs to build. International, for all its geographic spread, is close to a rounding factor in profit — a fact worth holding onto, because it is the segment the company is now spending heavily to enlarge.
The world it sells into
Allegion competes in a market its own filing calls "highly competitive and fragmented throughout the world, with a number of large multi-national companies and thousands of smaller regional and local companies," a fragmentation it attributes to local building codes and "highly variable end-user needs" [13]. Above that long tail sits a concentrated top tier. Allegion names its principal global competitors as Sweden's Assa Abloy and Switzerland's dormakaba, with Fortune Brands Innovations the main rival in North American residential [14]. dormakaba, describing the same market in its own report, puts numbers on the structure: it "remains highly fragmented, with the top-three companies holding only about one third of market share," and frames continued consolidation as its own strategy [15]. Two of the three largest players, independently, describe a field where scale still buys share and the runway to consolidate is long.
Demand in the profitable half of this market does not arrive the way it does for most building products. A commercial door opening is specified: before a school or hospital is built, Allegion's specification writers "work with architects, engineers and consultants to help design door openings and security systems to meet end-users' functional, aesthetic and regulatory requirements" [16]. Building and fire-life-safety codes then make whole product categories mandatory rather than optional — an exit device on a public assembly door, a closer on a fire door — so demand is anchored to code as much as to taste. Management describes the resulting business as "late cycle," carried by backlog and specification activity that lead construction spending by a couple of years. The mechanics of why being written into a specification is hard for a rival to dislodge — and where that advantage is genuinely contestable — is the subject of the next chapter (Written Into the Wall); here it is enough to know that this is how the money is ordered.
The market also splits by end use in a way that shaped 2025. Non-residential construction — institutional and commercial — is the resilient core; residential is rate-sensitive and softer. In 2025 Allegion Americas grew on pricing of 3.6% and volume of just 1.6%, as high-single-digit non-residential demand outweighed a residential decline [17]. dormakaba reports the identical divergence in its markets, and Fortune Brands guides US single-family construction lower — three players describing one demand pattern, which makes Allegion's non-residential tilt a structural feature of the industry rather than a one-year quirk.
The scoreboard
Allegion's 2025 results, placed beside the listed companies it is most often screened against, show the distance plainly. Its 21.1% operating margin trailed only Honeywell's 21.7% and ran to roughly double or more the three security- and building-hardware names — Fortune Brands at 11.6%, Stanley Black & Decker at 8.3%, Spectrum Brands at 4.4% — for a 1,120 basis-point gap to the 9.9% median. Its 16.9% free-cash-flow margin led the set outright, against a 7.1% median. And it grew revenue 7.8% while three of the four contracted, a 1,017 basis-point gap to a peer median that was itself negative.
Source: derived from reported FY2025 financials of Allegion and listed peers; peer median per the facts table.
Two honest qualifications keep this from being a victory lap. First, Honeywell is not really a comparable — it is a $158 billion diversified industrial whose access-control business is a fraction of the whole — so the fairest read is that Allegion earns roughly twice the margin of the security-hardware peers, not that it is uniquely profitable in all of industry. Second, and more important, the two competitors Allegion itself names as its principal global rivals — Assa Abloy and dormakaba, the only true door-hardware pure-plays — are absent from this numeric set; their income statements were unavailable, so the scoreboard benchmarks Allegion against adjacent diversified names rather than head-to-head against its own peers. The margin lead over building-products conglomerates is real and measured; a like-for-like comparison against the pure-plays is a gap the data here cannot close.
What the numeric record does show cleanly is direction. Gross margin has risen every year from 40.4% in 2022 to 45.2% in 2025, and operating margin alongside it from 17.9% to 21.1% — four consecutive years of expansion, not a single good print.
Source: derived from reported financials, FY2022–FY2025 Annual Reports (Form 10-K).
Why it is interesting now
Allegion is a specification-anchored North American door-hardware business that earns roughly double its building-products peers' margins and turns more than all of its earnings into cash. That cash is now being redirected into an accelerating program of bolt-on acquisitions that buy lower-margin international growth, even as the organic volume engine in its Americas core idles and pricing carries the top line, and even as its fastest-growing frontier — electronic and connected access — draws in larger, better-capitalized rivals. The market pays a modest premium for the combination, and re-tests that premium on every earnings print.
Each clause of that description is a later chapter. Why the Americas margin persists, and where the electronics shift makes it contestable, comes next (Written Into the Wall). Where the cash goes — and why the acquisition program is a bigger part of the story than the headline financials suggest — follows that (Where the Cash Goes). Whether management's word has been good, and the one recent place it has not, sits after (The Record and the Crack). And what today's price is underwriting closes the report (What the Price Expects). The starting point is the one established here: an ordinary-looking maker of locks and door closers that occupies the richest corner of its industry, and is measurably pulling away from the diversified field even as the field's true pure-plays sit outside the frame.
Written into the Wall
The margin established in The Richest Corner — a 27.9% operating margin in Allegion Americas, close to double the security-hardware field — is the sort of number that invites a plain question about durability. A lock is not a complicated object, and Allegion holds no patent on the idea of one. The durability does not sit in the product. It sits in where the product gets chosen: in the specification an architect writes for a building years before a door is hung, and in the fire- and life-safety codes that decide which categories of hardware a building is permitted to use at all.
The moat is a specification
Every commercial door opening is a small engineering problem. Allegion's own filing describes it precisely: most buildings have many openings, "each serving its own purpose and requiring different specific access control solutions," and each must be "configured to maximize a room's particular form and function while also meeting local and national building and safety code requirements" [1]. On institutional and commercial projects, the person solving that problem is frequently one of Allegion's own specification writers, who "work with architects, engineers and consultants to help design door openings and security systems to meet end-users' functional, aesthetic and regulatory requirements" [2].
The switching cost is what happens after the spec is written. A specified Von Duprin exit device or an LCN closer is a code-mandated, life-safety component — panic hardware that must let a building empty in an emergency — and it is a small fraction of a project's cost. To substitute a cheaper equivalent, a contractor has to re-specify the opening, re-verify it against code, and clear it back through the architect who signed the drawings, all to save a few dollars on a part carrying life-safety liability. The economics of that trade rarely work, which is why the spec, once written, tends to hold through a construction pipeline whose lead times run to a couple of years. Demand arrives already committed.
That mechanism, not brand sentiment, is what the numbers underneath the margin describe — a 45.2% gross margin. And the customer base is strikingly unconcentrated: Allegion's ten largest customers were roughly 26% of revenue in 2025, with no single customer above 10% [3]. A supplier that must please a handful of large buyers gives up price; one specified across thousands of independent projects sets terms.
The moat battery demands a sharper question than "is it strong": is this Allegion, or is it a good industry anyone in it would enjoy? The most credible witness is a rival with no reason to flatter Allegion. dormakaba — the nearest listed pure-play to Allegion's model — describes the same economics in its own annual report, unprompted: its business is "characterized by high resilience and barriers to entry as well as strong profit pools," because "digitalization, country-specific regulation, complex system integration, and continuing aftersales service all foster the customers' need for a close and continuing partnership with their chosen supplier" [4]. So the switching cost is structural to the niche and shared across its serious players; the barrier is real but it is the industry's as much as Allegion's. Allegion's incremental edge is the density of its Americas specification position and installed base — the count of openings already written to Schlage, Von Duprin and LCN. Its supply-chain speed is a genuine operational strength, but execution is not a moat, and the two should not be confused: one earns the margin, the other merely protects it in a bad year.
Pricing that recovers cost, and mix that lifts margin
The four consecutive years of margin expansion charted in The Richest Corner are the clearest evidence that the pricing power is real rather than asserted. The more useful question is what kind of pricing power it is. In FY2025 the Americas segment grew 6.9%, and price did most of the work: pricing contributed 3.6 points, volume 1.6, acquisitions 1.8, currency a slight drag [5].
The margin bridge, though, tells nearly the opposite of the intuitive story. Of the 0.8-point rise in Americas operating margin, volume and product mix supplied 0.9 points while pricing and productivity in excess of inflation were a 0.3-point drag [6].
Source: FY2025 Annual Report (Form 10-K), Allegion Americas segment operating-margin bridge [7].
The reconciliation is that the 2024–25 price increases were, in large part, tariff and input-cost recovery rather than a widening of the spread. Management has been unusually candid about the mechanism: it "offset inflation due to tariffs with pricing actions" [8], running a playbook of "surcharges" and then "list price increases" to cover roughly a point of COGS inflation [9], and it has guided 2026 to be "more list price increases" with slightly less total pricing [10]. The calibrated read: Allegion can push price through without losing the specified position — that is real pricing power, and it is not common — but recent margin gains have leaned more on volume, mix and productivity than on raw price. Price defends the dollars; mix expands the rate. With residential volumes still soft and the organic Americas volume engine idling (the thread carried in The Richest Corner), the margin-accretive lever is the one running slower, and it is the line to watch for margin direction from here.
Sourcing is where the same cost pressure becomes a relative advantage rather than a wound. Allegion estimates it sources 20–25% of cost of goods sold from Mexico and less than 5% from China [11], with much of its US residential portfolio built in the Baja region of Mexico under the Maquiladora program [12]. Producing in the region of use, largely inside the USMCA framework, means the tariff regime that disrupted import-heavier rivals reaches Allegion's cost base more gently. This is a relative edge, not an immunity: 20–25% of COGS sitting in Mexico is also the precise channel through which a trade-policy shock would arrive, so the advantage holds only as long as North American trade stays inside its current rules.
The electronics edge is where it is contestable
The mix is shifting underneath the moat. Electronic security products are roughly a quarter of revenue [13] and grew low-double-digits in FY2025, faster than the mechanical core [14]. Data centers, a new and rapidly growing vertical, are "approaching 5% of our non-res business" and seed a future aftermarket as their installed base ages [15]. Allegion's own 10-K names the consequence plainly: as it moves "into more technologically advanced product categories," it "may also compete against new, more specialized competitors" [16].
This is the part of the franchise where the margin premium is genuinely testable, and the reason is structural. The specification and architect relationship is at its strongest in mechanical, institutional openings governed by code. In connected access the ground shifts: the buyer moves toward IT and systems integrators, the product has to live inside software platforms and consumer ecosystems, and the competitor set becomes the largest balance sheets in the building-technology world rather than the fragmented long tail of lock makers. The convergence is already in the filings:
Sources: Honeywell FY2025 10-K [17]; Allegion Q4 FY2021 call [18]; Fortune Brands FY2024 10-K [19]; Allegion FY2022 10-K [20]; Spectrum Brands FY2025 10-K [21]; dormakaba FY2025 AR [22].
The single largest of these moves is Honeywell's: in June 2024 it acquired Carrier's Global Access Solutions business — electronic locking systems and contactless mobile keys — for total consideration of $4,913 million, and folded it into a Building Automation segment it can cross-sell across an installed base far larger than Allegion's [23]. In residential smart locks, Fortune Brands sells Yale and August and, in its own 10-K, lists Schlage — Allegion's flagship — among the brands it competes with [24]. And Allegion's own management, asked about Assa Abloy years ago, conceded the electronics gap directly: Assa runs "4 times or 5 times" Allegion's inventory globally, and "their electronics position is particularly driven by HID gives an advantage there" [25]. The mechanical moat is not in immediate danger; the question the electronics mix-shift poses is whether the same premium travels into an arena where Allegion is not the scale leader.
The field that consolidated around it
Part of why the electronics threat looks larger than the day-to-day competition is that the ordinary competition thinned. Two listed US names left the security category outright, and Allegion was on the buying side of one of them. In 2022 Allegion itself bought Stanley Access Technologies — the automatic-doors business, which patented the first hands-free door operator in 1931 — from Stanley Black & Decker for $923.1 million, adding a service-heavy non-residential franchise [26]. A year later Spectrum Brands sold its HHI hardware segment — Kwikset and Baldwin — to Assa Abloy for cash proceeds of $4.3 billion [27]. This is the reason the peer scoreboard in The Richest Corner reads as a list of diversified industrials rather than door-hardware pure-plays: the pure-plays either belong to Allegion now, or belong to a European rival that does not file a comparable US income statement.
The consolidation did not close the field, though — it re-drew it around the two survivors that matter, and both are still hunting. dormakaba, having "stepped up" its acquisition activity, launched a North America Growth Plan aimed squarely at strengthening its position in Allegion's largest and most profitable market [28]. The fragmentation established earlier — the top three suppliers hold only about a third of the market — is a fact that cuts in both directions. It is the runway that lets Allegion keep bolting on share, and it is the opening that lets a well-capitalized rival do the same in reverse.
Where this leaves the reader is a moat that is real, measurable and unevenly distributed. In mechanical, institutional, code-governed openings, Allegion's product is written into the wall before the wall exists, and defended by pricing that mostly recovers cost while mix and productivity do the margin work. It is most contestable at the electronic frontier, where demand is growing fastest and the largest balance sheets in the industry are converging on the same customers. That tension sets up the next act: the cash this richest corner generates is now being redirected into buying growth in precisely the lower-margin international and electronic arenas where the edge is least proven (Where the Cash Goes).
Where the Cash Goes
The two acts before this one built a business that earns roughly double its peers' margins out of a single Americas engine — a position written into the wall of institutional buildings and slow to dislodge. This act follows the money that engine throws off. In 2025 Allegion generated more free cash flow than in any year of its public life — $685.7 million — and handed less of it back to shareholders than it had the year before [1]. Dividends plus buybacks fell from $387.0 million in 2024 to $255.3 million in 2025. That is not a contradiction. It is the whole capital story compressed into a single line, and the rest of this chapter unpacks where the difference went.
Earnings that turn into cash
The quality of the cash itself comes first, because everything downstream depends on it being real. Allegion's reported profit converts to cash with almost no leakage. Operating cash flow has exceeded net earnings in every year of the window and the gap has widened, not narrowed: operating cash flow was 1.11 times net earnings in 2023, 1.13 times in 2024, and 1.22 times in 2025 [2]. After capital spending, free cash flow of $685.7 million was still 1.07 times the $643.8 million of net earnings [3]. A company earning more accounting profit than the cash it collects is where accounting problems hide; Allegion has the opposite signature.
Source: FY2025 Annual Report (Form 10-K), Consolidated Statements of Cash Flows [4].
Two mechanics drive that conversion. The first is that the model barely consumes capital: 2025 capital expenditure was $98.1 million, or 2.4% of revenue, against depreciation and amortization of $133.2 million [5]. When a business's non-cash charges run above the cash it reinvests, reported earnings understate the cash the operation releases. The second is that working capital is close to neutral: in 2025 receivables actually released $23.7 million of cash even as revenue grew 7.8%, and the accounts-payable and inventory movements roughly offset [6].
Free Cash Flow 2025 ($M)
FCF / Net Earnings
Capex / Revenue
Cash into Deals ($M)
Source: FY2025 Annual Report (Form 10-K), Consolidated Statements of Cash Flows [7].
One line resists the clean reading, and it is worth pausing on because it looks like a warning sign and is not. Inventory on the balance sheet jumped 22.7%, from $423.0 million to $519.0 million, far ahead of 7.8% revenue growth — the kind of divergence that often flags demand that management expected and did not get [8]. But the cash-flow statement shows inventories drew only $38.9 million of cash [9], and the acquisition note shows businesses bought during the year arrived carrying $38.9 million of net working capital [10]. The balance-sheet build is largely stock that came in with the deals, not an organic ramp against soft orders. Which points at the real subject of this chapter: the deals.
The largest line the numbers hide
There is a trap in the standardized data for this company, and any reader modeling Allegion from a data feed will fall into it. The canonical figures record cash spent on acquisitions as $0.00 in 2022, 2023, 2024 and 2025 — implying a business that makes no acquisitions and returns all its cash. The audited cash-flow statement says the opposite. The line "Acquisition of and equity investments in businesses, net of cash acquired" shows outflows of $31.7 million in 2023, $137.2 million in 2024, and $592.2 million in 2025 [11], and the 2022 accounts record $923.1 million of cash paid for a single deal [12]. In 2025, Allegion used $685.5 million in investing activities; with capital spending only $98.1 million of that, the remainder is deals [13]. Acquisitions are not a footnote to this company's capital allocation. In three of the last four years they are the single largest discretionary use of cash.
That correction is exactly what explains the drop the chapter opened with. Buybacks plus dividends fell from 66.4% of free cash flow in 2024 to 37.2% in 2025 [14]. Read against a $0 acquisition line, that looks like cash piling up unspent. Read against a $592.2 million acquisition line, it is straightforward: free cash flow hit a record, the dividend rose, and buybacks were cut to $80 million to help fund the largest deal year in the company's history. The falling payout ratio is not idle cash. It is the acquisition program showing up as a claim on the same dollars.
Sources: FY2025 Annual Report (Form 10-K), Consolidated Statements of Cash Flows [15]; FY2022 10-K, MD&A Liquidity (2022 acquisition) [16].
An acquirer, accelerating
The shape of the bars matters as much as their height. In 2022 Allegion made one large, debt-financed purchase — the $923.1 million Stanley Access Technologies deal, the automatic-entrance business it bought from Stanley Black and Decker and folded into the Americas segment [17]. Then 2023 was quiet, at $31.7 million. What followed is the pattern to watch: a rising cadence of smaller "bolt-on" deals — five in 2024 for $137.2 million, then nine in 2025 for aggregate consideration of roughly $631.6 million, of which $592.2 million was cash out the door [18]. A bolt-on is a small company bought to slot into an existing line rather than to open a new business; the 2025 slate ran from a U.S. multifamily access-control provider to U.K. and Australian hardware makers, led by ELATEC, a German electronics-and-access-technology manufacturer bought for €327.9 million (about $386.5 million) and placed in the International segment [19].
On the earnings call, management framed the year the same way the cash flow does: "$630 million was used for bolt-on acquisitions," alongside "a twelfth consecutive annual dividend increase," with the stated priority "towards profitable growth" [20]. The order of that sentence is worth keeping: deals first, dividend second.
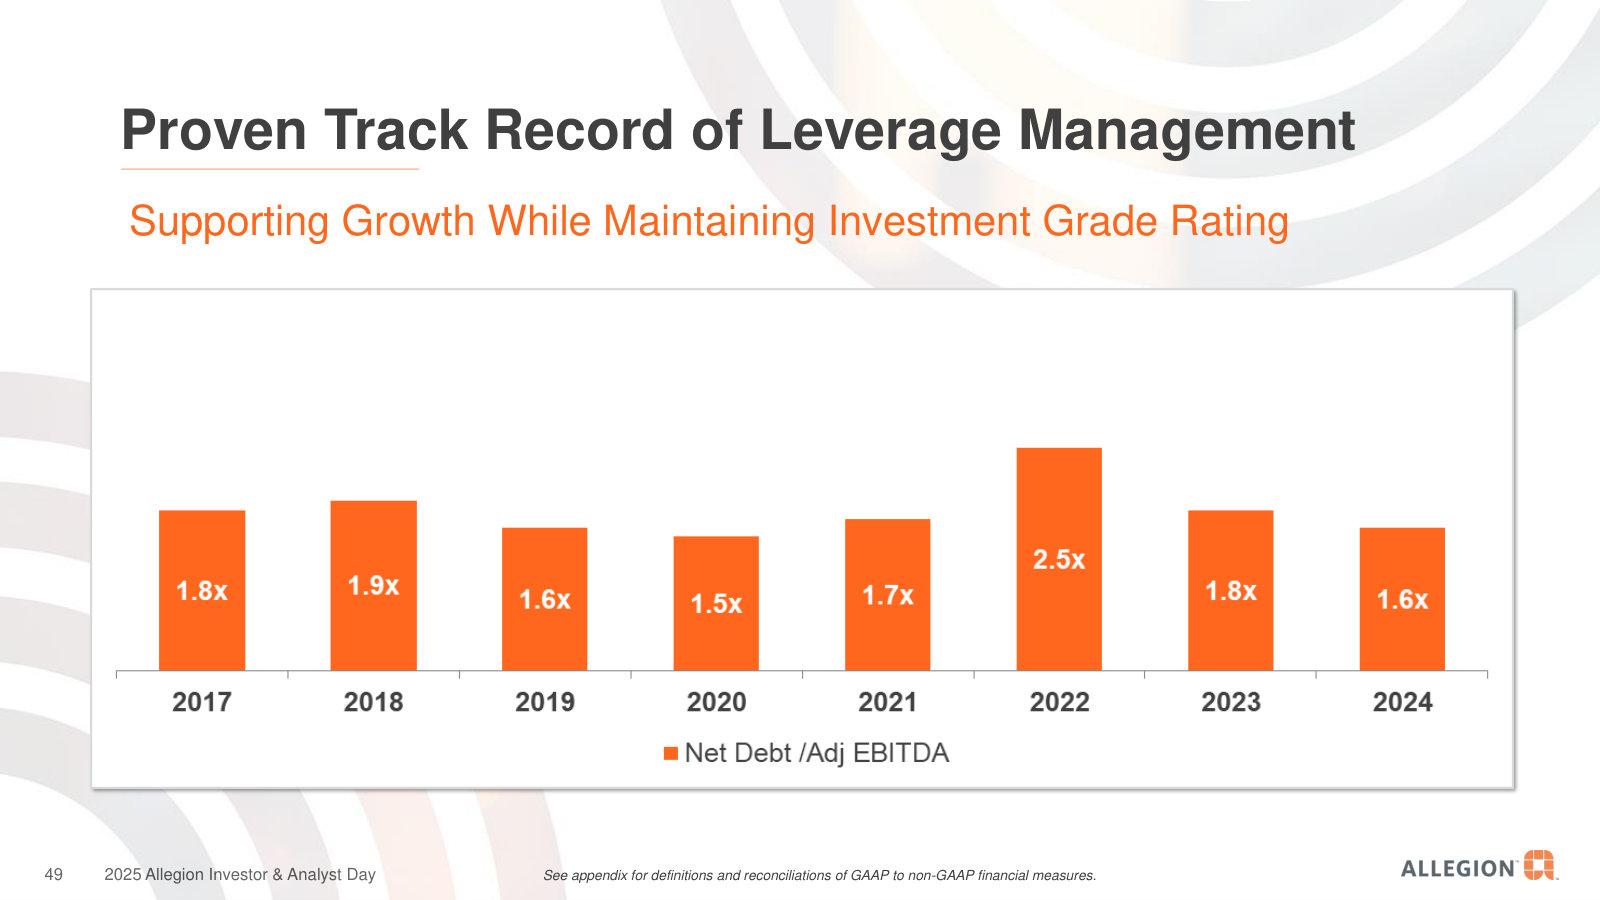
The program is funded off a balance sheet deliberately kept with room to spare. Net debt has hovered near $1.5–1.8 billion for years, and Allegion manages leverage to an investment-grade target. Its own history slide shows net debt at 1.6 times adjusted EBITDA at the end of 2024, having spiked to 2.5 times in 2022 for the Access Technologies deal and de-levered within two years [21]; management put the ratio at 1.6 times again at the end of 2025, "which supports continued capital deployment" [22].
Sources: May 2025 Investor Presentation, Leverage Management (2019–2022, 2024) [23]; Q4 FY2023 earnings call (2023 year-end 1.9x) [24]; Q4 FY2025 earnings call (2025 year-end 1.6x) [25].
Two moves at the end of 2025 read as preparation for the next wave rather than a pause. Allegion enlarged its revolving credit line from $750 million to $1.0 billion and pushed the maturity out to 2030, using it to retire a term loan; its senior notes are laddered across 2027, 2029, 2032 and 2034, so there is no near-term refinancing wall [26]. A larger revolver on a lightly levered balance sheet is dry powder held ready.
The dividend and the residual
Against the acquisitions, the two forms of direct shareholder return look small and play different roles. The dividend is the reliable one. Allegion has raised it for twelve straight years, taking the quarterly rate to $0.55 for 2026 from $0.51, a 7.8% step, and paid $175.3 million in 2025 [27]. But the dividend has grown more slowly than the cash behind it — cash dividends rose from $143.9 million in 2022 to $175.3 million in 2025, roughly 7% a year, while free cash flow compounded far faster — so the share of cash paid out as dividends has been drifting down, not up.
Buybacks are the flex variable, and 2025 shows how far down the queue they sit. Allegion spent $80 million repurchasing about 0.6 million shares and bought none at all in the fourth quarter; $160 million remained available under a $500 million authorization first set in 2023 [28]. Management describes the buyback's job narrowly: "at a minimum, we intend to offset the creep from share-based compensation" [29]. That is close to what happened — 0.4 million shares were issued into equity plans and 0.6 million bought back, leaving ordinary shares outstanding down fractionally at 86.1 million [30]. Diluted share count has fallen only about 1.9% across three years — a slower reduction than the roughly 2.7% median cut at the four listed peers in 2025, as reported across the peer set. Per-share compounding from repurchases is, for now, a rounding factor; the capital that could drive it is going to deals instead.
What the balance sheet is absorbing
Every acquisition leaves a residue on the balance sheet, and after two busy years Allegion's is visibly heavier. Goodwill rose 28% in a single year, from $1,489.4 million to $1,912.4 million, and now stands at 37% of the company's $5,223.7 million of total assets [31]. Add the $826.0 million of net acquired intangibles and the two soft-asset lines together — $2,738.4 million — exceed the company's entire $2,067.6 million of shareholders' equity [32]. This is what a bought-growth strategy looks like carried on the books: the accounting value of the enterprise is increasingly the price paid for other companies.
Source: FY2025 Annual Report (Form 10-K), Consolidated Balance Sheets [33].
Almost all of the fresh goodwill landed in one place. International goodwill roughly doubled, from $303.5 million to $631.3 million, while the Americas figure rose only modestly [34]. That is the mechanical proof of a point the richest corner left open: International revenue growth is bought, not earned. Total assets in the International segment jumped from $1,146.0 million to $1,886.1 million on the deal wave [35]. And what is being bought enters at a fraction of the home margin: as The Richest Corner established, the International segment earned a 9.0% operating margin in 2025 against the Americas' 27.9% [36]. Allegion is redeploying cash earned at 28 cents on the revenue dollar into businesses that, so far, earn nine.
Three facts bound how much a reader should trust this program before its returns are visible. First, it is too young to judge on results: the nine deals closed in 2025 contributed only $93.0 million of revenue and $4.7 million of pre-tax earnings from their closing dates to year-end [37]. Second, there is a base rate, and it is not spotless: the International segment still carries $573.6 million of accumulated goodwill impairment from an earlier era of deals — a write-off close to a full year of today's free cash flow — even though nothing has been impaired since 2023 [38]. Allegion's history of buying international growth includes at least one large sum that did not earn its keep. Third, the cost of running the machine is treated as if it were not a running cost. Acquisition and integration expenses recur every year — $21.0 million in 2023, $11.4 million in 2024, $14.6 million in 2025 — booked in selling and administrative expense, and Allegion adds them back to the adjusted-earnings, adjusted-EBITDA and available-cash-flow measures it features in its reporting [39]. For a company doing nine deals a year, those "one-off" costs are a permanent feature of the operating model, so the adjusted numbers sit structurally above the audited ones — a gap the record chapter revisits where those same adjusted metrics drive management pay.
None of this is a reporting red flag. PwC signed a clean opinion on both the accounts and internal controls, with a single critical audit matter on revenue recognition and no restatement [40], and the cash conversion behind the numbers is genuine [41]. The point is narrower and more useful: Allegion is not the all-cash-returning compounder its headline free cash flow suggests. It is a cash machine that has chosen to spend its surplus buying lower-margin growth, on an accelerating schedule, with the returns still unproven and a mixed record behind it. Whether that redeployment pays — and whether the company can operate what it is buying — is the swing factor in per-share value from here. It also lands the story in a suggestive place: the one segment now absorbing the most capital is the same one that houses the company's only recent stumble, which is where the record itself comes up for examination.
The team that owns the record
The segment now absorbing the most acquisition capital (Where the Cash Goes) is also the one place the company has recently stumbled — so the question turns from what Allegion earns to whether the people running it have been good for their word. The useful answer is short, because the record that matters is short. The team that built today's numbers arrived in 2022.
Allegion has been a standalone company since the 2013 spin-off, but its management is a decade younger than that. Mike Wagnes stepped into the CFO seat on March 1, 2022, succeeding the founding-era finance chief Patrick Shannon [1]. By the third-quarter call that October, John Stone — hired from Deere, where he had run its worldwide construction, forestry and power-systems business — was in the chief-executive chair, where he remains [2]. Neither is a founder; both are professional operators. Under them, the margin expansion the earlier chapters treated as the company's signature — the four-year climb charted in The Richest Corner — is, in dated terms, this team's work.
Source: leadership dates per the FY2021 earnings call and 2025 proxy [3] [4].
Two consequences follow, and they run through the rest of this chapter. First, the credible record below is almost entirely the incumbent team's; promises made before 2022 were made by different people. Second — and this is the thread that connects to the live crack — that record was earned overwhelmingly in the Americas, the engine established in The Richest Corner. What management has not yet proven is that the same discipline travels to the International segment it is now buying into.
Guide low, beat — three years, one honest miss
The heart of a track record is the said-versus-did ledger: what management put in writing at the start of a year, and what the year actually delivered. Allegion's pattern is consistent enough to have a name inside the investor base — guide conservatively in February, raise through the year, finish above the original range.
*FY2022 figures are on the pre-2023 reporting basis (before Allegion excluded acquired-intangible amortization from adjusted EPS in January 2023); each row compares a guide and an actual struck on the same basis. Sources: FY2022 initial guide [5]; FY2022 actual EPS [6]; FY2022 revenue actual [7]; FY2023 guide [8]; FY2023 actual EPS [9]; FY2025 EPS guide [10]; FY2025 revenue guide [11]; FY2025 actual EPS [12]; revenue actuals as reported.
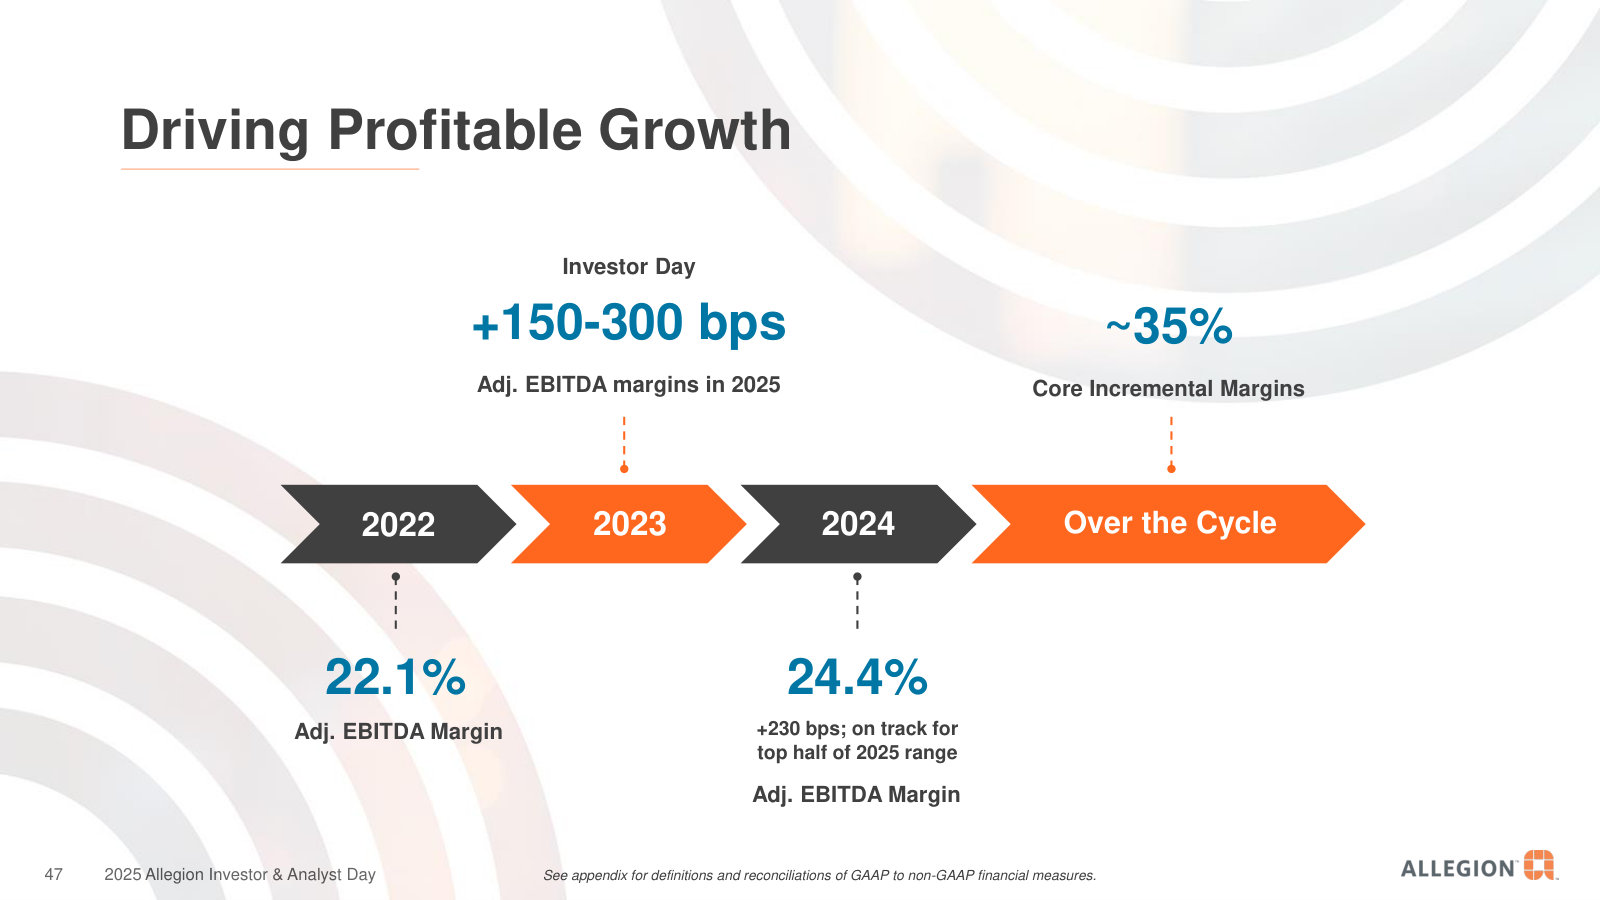
Across the rows, the shape is the same each time. The FY2022 outlook of $5.55 to $5.75 in adjusted EPS and roughly 6% to 7.5% total revenue growth [13] gave way to $5.99 and 14.1% [14] [15]. One honest caveat sharpens rather than softens the point: that February 2022 guide was the outgoing CFO's, so FY2022 is a handoff year the new team finished. The two years that are unambiguously theirs — FY2023's $6.30-to-$6.50 guide landing at $6.96 [16] [17], and FY2025's $7.65-to-$7.85 guide landing at $8.14 [18] [19] — carry the same signature. FY2025 was raised twice along the way, from the original range to $8.00-$8.15 at mid-year [20] and then $8.10-$8.20 in the third quarter [21], before the year cleared even that. FY2023 itself closed as a record year — revenue, adjusted operating income and adjusted EPS each at a high, with adjusted operating margin reaching 22.1%, up 160 basis points [22].
The same calibration showed up in the last real stress test. Through the 2022 selloff — the inflation shock, not a demand collapse — management's message was that price would catch up to cost and rebuild margins: on the third-quarter 2022 call it stayed "committed to addressing inflation" with substantial price realization, reported non-residential Americas growth near 30%, and raised guidance into the drawdown [23]. What came after matched the words: operating margin expanded in every subsequent year, 17.9% to 19.6% to 20.7% to 21.1%. A drawdown-era promise that the numbers later kept is the kind of evidence that gives management's framing predictive value.
What keeps the ledger from reading as curated is the one clean miss inside it. FY2022 available cash flow was guided to $465 million to $485 million [24] and came in at $395.5 million [25] — a shortfall management labelled "less-than-expected" and attributed plainly to inventory it chose to carry and capital it pulled forward, rather than reframing away [26]. Cash flow then compounded — $516.4 million, $582.9 million, $685.7 million — to a record by FY2025. A miss disclosed rather than dressed up, and subsequently recovered, is worth more to a reader than another beat.
One capital promise on the balance sheet
Guidance is talk until a large decision forces it into the balance sheet. Allegion's came in 2022, when it bought the Access Technologies automatic-door business — the deal anatomised in Where the Cash Goes — and financed it with debt. The commitment attached to it was specific and checkable: lever up for the acquisition, then bring leverage back down. Net debt to adjusted EBITDA jumped from 1.7x at the end of 2021 to a peak of 3.3x on the deal, closing 2022 already back to 2.5x [27].
The line came down as promised, the same leverage path charted in Where the Cash Goes — 1.9x by the end of 2023 [28] and 1.6x at the end of both 2024 and 2025 [29] [30], even as the 2025 acquisition wave resumed. A promise made about the balance sheet, honored on the balance sheet, is the sturdiest kind — it is arithmetic, not narrative. It is also the standing test for the next cycle of deals: the discipline is proven for one large, well-timed acquisition, not yet for a nine-a-year cadence.
A self-inflicted stumble in International
Against that record sits the one execution failure of the current window, and its location is the point. It is not in the Americas engine; it is in International — the segment Where the Cash Goes showed the company buying into at a fraction of Americas margins.
In the first quarter of 2026, International organic revenue turned negative and its operating margin fell 220 basis points, and management attributed the damage to an ERP-system implementation in one of its legacy mechanical businesses — framing it as execution, not demand, and promising to recover the lost production over the year [31]. By the second quarter the software problem had eased, but the segment had not recovered: International organic revenue was still down 1.2%, now on genuinely weaker demand in Germany — its largest international market — where the company took additional restructuring actions [32]. Management cut its full-year International organic outlook to a low-single-digit decline [33].
The honest read has two parts. The self-inflicted piece — the ERP disruption — was contained and recovered roughly as promised, a small said-versus-did test the team passed. But it surfaced inside a segment that was independently softening, so the recovery it promised is partly displaced by a demand problem it did not create and cannot fix by execution alone. This is the live, dated commitment a reader can hold the company to: International organic growth, and whether the segment now receiving the most capital can be made to perform. It sits, pointedly, in the same place as the credibility record's blind spot — the record is Americas-carried, and so, still, is the proof.
Conventional governance, one incentive wrinkle
The people question sits underneath all of this, and here Allegion is deliberately unremarkable. The board is eight directors, seven of them independent, with the chief executive the only insider [34]. The chair is independent and separate from the CEO — Lauren Peters, a former Foot Locker CFO, in that seat since 2024 — and all three standing committees are fully independent [35]. There is no founder, family, or control block.
There is also almost no insider ownership. As of March 2025 all directors and executive officers as a group — nineteen people — held 195,734 ordinary shares plus 386,106 options exercisable within sixty days, together well under 1% of the roughly 86 million shares outstanding [36]. Management's alignment with shareholders is therefore a designed thing, not an inherited one: it rests on the annual equity grant and a six-times-salary ownership requirement for the CEO [37], rather than a large personal stake. For a reader who prizes owner-operator skin in the game, that is a fact to weigh; for one who prizes clean oversight, the absence of a control person is the more relevant one.
The pay plan is standard-issue and well-fenced. The annual cash incentive scores three equally weighted, committee-adjusted metrics — adjusted revenue, adjusted operating income, and adjusted available cash flow — capped at 200% of target [38]. Long-term awards are half performance shares, split evenly between adjusted-EPS and total-shareholder-return goals measured against the S&P 400 Capital Goods index, with clawbacks and anti-pledging rules attached [39]. The caps and clawbacks bound the gaming surface; the discretion lives in the word "adjusted."
That is where the one wrinkle worth naming appears — stated as evidence, not a judgment on the pay. For the 2022-2024 performance shares, the adjusted-EPS half paid 174% of target, on adjusted EPS of $7.47 against a $6.74 goal, while the total-shareholder-return half paid 60%, because realized relative return landed in the 30th percentile of the peer set — a 10.1% three-year TSR. Blended, the award paid 117% of target [40].
The plan rewarded operating-metric achievement well above target even as realized relative shareholder return sat in the bottom third of the peer group.
Source: 2022–2024 performance-share payout, 2025 proxy [41].
The wrinkle compounds a thread Where the Cash Goes opened: the adjusted figures that pay management are the same ones lifted above GAAP by acquisition and integration costs that recur every year for a serial acquirer. None of this is self-dealing — the proxy reports no related-party transactions, and the structure is textbook large-cap. It simply means the scorecard management is paid against is an operating scorecard the committee tunes, and one that, in the last completed cycle, ran ahead of the return shareholders actually realized.
Where this leaves the record
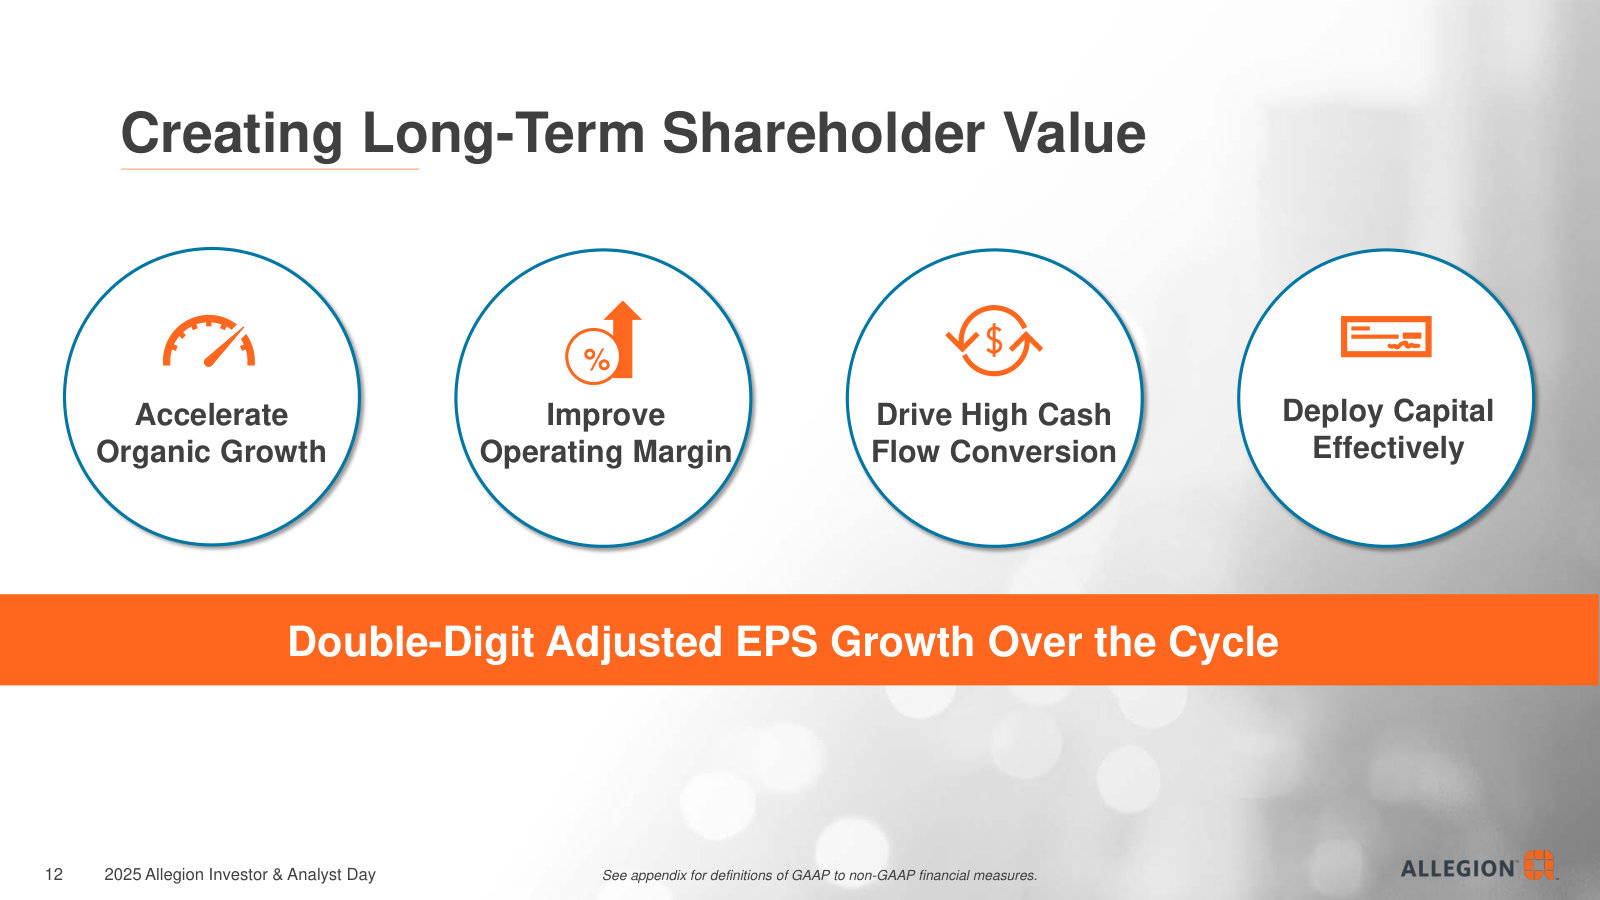
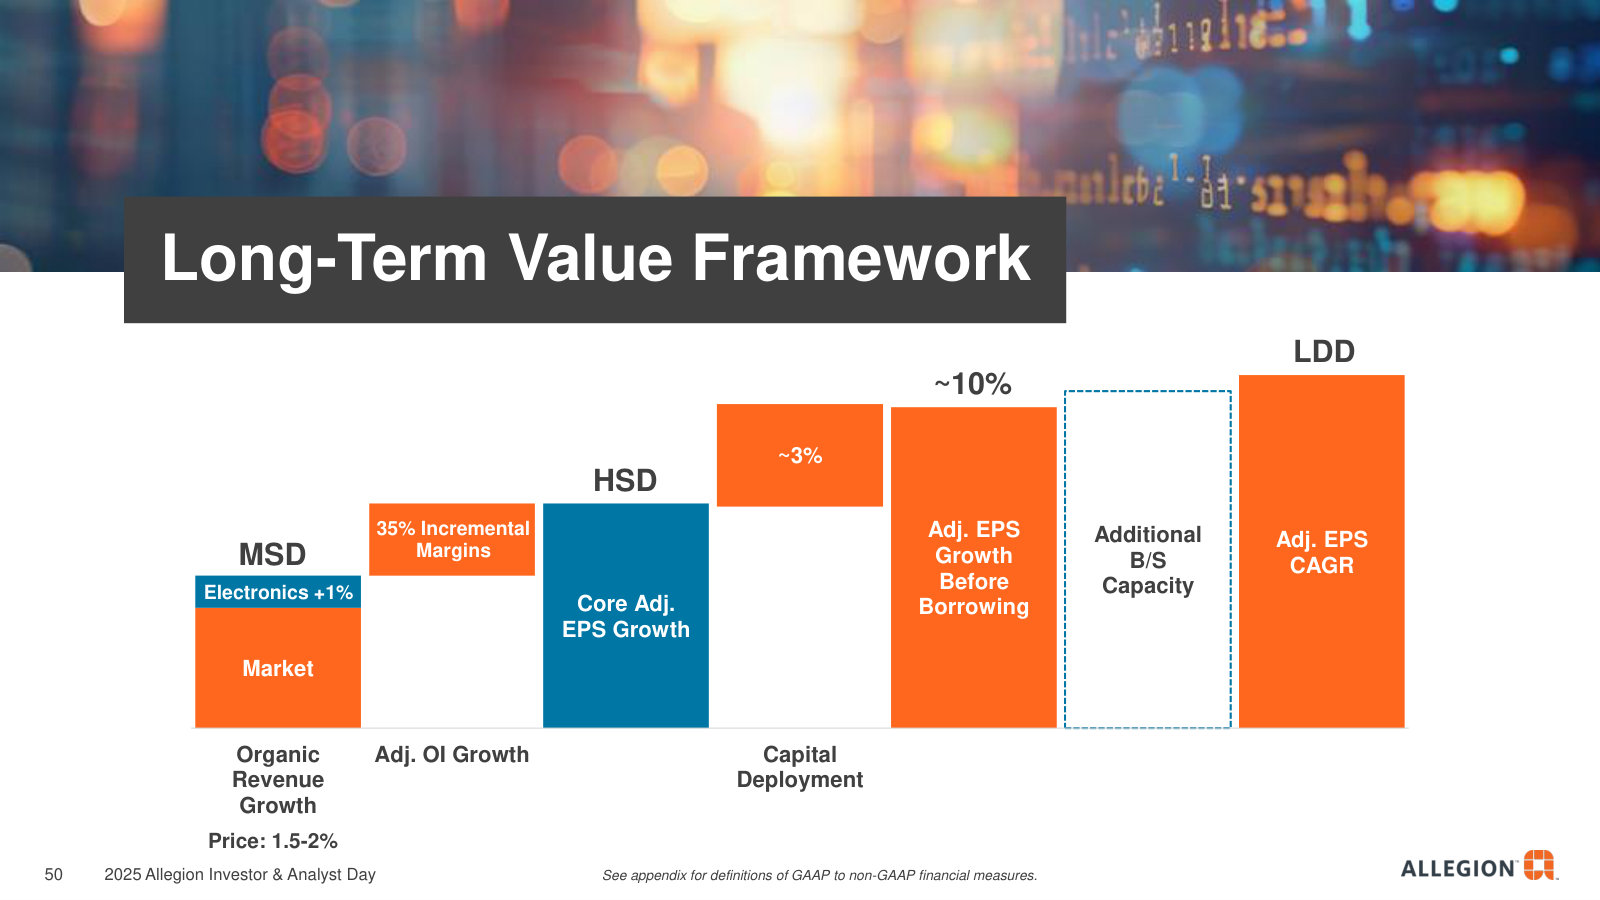
Set against management's own forward marker — the 2025 Investor Day commitment to double-digit adjusted-EPS growth over the cycle [42] — the honest state of the record is this. The said-versus-did ledger is genuinely good: three initial guides beaten, a drawdown-era margin promise delivered, one candidly disclosed cash-flow miss, and a large capital promise honored on the balance sheet. But it is short, it belongs to a team barely four years in the seat, and it is overwhelmingly Americas-carried — the only open, dated commitment a skeptic can hold the company to is an International recovery in the very segment the capital is now flowing toward. That record, and the price the market is willing to pay for it, is what the closing act takes up.
What the Price Expects
By the close on July 27, 2026, Allegion traded at $158.14, a market value of $13.69 billion and — with $1.62 billion of net debt — an enterprise value near $15.3 billion. That price is the last line of the story the earlier chapters told: a business that earns the richest margins in its comparison set (The richest corner), defends them by being written into building specifications (Written into the Wall), converts more than all its earnings to cash and is now redirecting that cash into bought international growth (Where the Cash Goes), run by a team whose word has mostly been good (Track Record). This chapter turns that record into arithmetic: what growth, margin and cash-conversion path a buyer at $158 is underwriting, how far sentiment moved to get here, and which of the tensions the earlier acts raised are the ones the valuation actually rests on.
The multiple, as arithmetic
Forward P/E (FY2026E)
Trailing FCF Yield
EV / EBITDA (FY2026E)
Dividend Yield
Sources: price and share count as reported; forward multiples derived from consensus estimates; trailing free cash flow of $685.7M from the FY2025 cash flow statement [1].
Trailing free cash flow of $685.7 million against the $13.69 billion market value is a 5.0% yield — roughly 20 times cash flow [2]. On earnings, the price is about 17.7 times consensus FY2026 EPS of $8.94, 16.3 times FY2027's $9.72, and 14.8 times FY2028's $10.68 — a multiple that steps down each year only because the earnings line is modeled to keep climbing. On the trailing year the same price is roughly 19 times FY2025 adjusted EPS of $8.14, or 21 times the $7.44 the company actually reported under GAAP. The dividend adds about 1.3%: $175.3 million paid last year, lifted to a $0.55 quarterly rate, a steady but minor part of the return.
None of those numbers is high or low on its own. What makes them a premium is the company they keep.
A premium built on margins
Source: FY2025 peer comparison, derived from reported financials; prices as reported.
Allegion's 5.0% free-cash-flow yield sits about 87 basis points below the 5.9% peer median — a richer multiple than the median name in the set. What the reader is paying up for is visible one column to the left: a 21.1% operating margin and a 16.9% free-cash-flow margin, both the highest in the group and roughly double the medians. The premium is a margin premium, priced against exactly the durability question raised in Written into the Wall — whether the specification moat that produces those margins holds as the fastest-growing, most contested electronic products grow into the mix.
Source: FY2025 peer comparison, derived from reported financials; prices as reported.
The one peer whose margin rivals Allegion's — Honeywell, at 21.7% — trades richer still, on a 3.4% free-cash-flow yield, so the market is not treating high margins as a reason to discount. The cheaper names in the set carry the lower margins: Spectrum Brands yields 7.2% on a 4.4% operating margin. The scatter reads as a fair-value line the market has drawn between quality and yield, with Allegion priced on it rather than off it. That is the calm reading. The tape over the last six months was anything but calm.
A round trip the headline hides
The facts table shows Allegion 12.0% below its high, close to the 10.9% peer median — a mild-looking number. It hides a full round trip. Inside the same window the stock peaked at $179.77 on February 6, fell to $125.65 by May 15 — a 30.1% peak-to-trough decline — then rebounded 25.9% to $158.
Source: daily closing prices, as reported (Jan 28 – Jul 27, 2026).
Each leg is dated to an earnings print, not to macro drift. The stock fell 9.4% on February 17, when the Q4 FY2025 result missed on both lines (revenue 0.4% light, EPS 2.0% short) and the company set an initial 2026 guide the market read as cautious. It fell another 7.1% on April 28, when Q1 FY2026 EPS missed by 5.1% on the self-inflicted international ERP stumble described in Track Record. Then on July 23 it jumped 10.5% — on roughly four times normal volume — when Q2 FY2026 beat revenue by 2.8% and EPS by 8.3%, and management raised the full-year adjusted-EPS outlook to $8.85–$9.00 with organic growth lifted to 3.5%–4.5% [3].
Source: daily price moves and consensus beat/miss, as reported.
Two features matter for reading the price today. First, expectations were reset down about 30% and re-elevated to near the prior level in six months, so the mild headline drawdown understates how much the market's mind changed. Second, the recovery leans on two consecutive revenue beats and one large EPS beat: the stock is priced as if the Q2 momentum is the trend, and management's own framing on the July call — that specification activity is pointing to "positive momentum for non-residential projects over the next 12 to 18 months" — is doing work in that price [4]. One honest limit: the price series available here runs only from late January 2026, so the "high" this drawdown is measured against is that February peak, not a verified multi-year high; a longer lookback could show a deeper decline.
What consensus is underwriting
Behind the multiple is a specific forecast. Consensus has revenue growing 8.5% in FY2026 — faster than FY2025's actual 7.8%, and against a peer median that shrank 2.3% — then decelerating to about 5% a year through FY2028 ($4.41bn, $4.63bn, $4.86bn). Normalized EPS is modeled to compound roughly 9%–10%, ahead of revenue, which means the forecast bakes in both continued margin expansion and the drip of buybacks. That EPS pace sits just below the "double-digit adjusted-EPS growth over the cycle" standard management set at its 2025 Investor Day, noted in Track Record — so consensus is underwriting management's framework at a modest discount, not a premium.
Source: FY2025 as reported; FY2026E–FY2028E consensus estimates.
The more revealing detail is what is supposed to drive that top line. Broker models show a handoff: the pricing that carried revenue through the inflation years fades — from about 3.1 points of growth in FY2026 to 1.3 by FY2028 — while volume is modeled to more than double its contribution, and the acquisition contribution that added 3.3 points rolls to essentially zero. Organic growth holds near 4.4% only if that volume rebound actually arrives.
Source: broker models, consensus estimates; growth-bridge contributions in percentage points.
That handoff is the quality question the earlier chapters left open, now in the numbers. The pricing that is fading is the cost-recovery pricing described in Written into the Wall; the acquisitions rolling to zero are the accelerating program in Where the Cash Goes, which the models simply stop crediting rather than extrapolate. And the international recovery the model needs — organic growth swinging from −1.2% in FY2026 to +3.6% in FY2027 — sits in the exact segment holding the company's only recent execution failure. On the July call management confirmed international was still down 1.2% organically on German weakness, recovered sequentially from the ERP disruption, and layered in about $10 million of annual restructuring savings [5].
One tension deserves a plain statement. Consensus pays up for 8.5% revenue growth, yet models near-flat free cash flow — an implied FY2026 figure around $690 million against $685.7 million trailing, and a forward free-cash-flow yield still at 5.0%. The growth the price is buying does not, on these estimates, translate into more free cash flow per share next year. And the forecast thins as it lengthens: FY2027 EPS spans $9.29 to $10.35 across 11 analysts, FY2028 draws only five, and every FY2029 figure rests on a single estimate — so the outer-year compounding embedded in the multiple is a small-panel view, not a firm consensus.
The live questions
The valuation is most sensitive to four questions the earlier chapters raised and could not close. None is settled; each is a shared fact with a live disagreement and a specific thing that would settle it.
Sources: FY2025 peer comparison and segment disclosures, derived from reported financials; broker models and consensus estimates; Q2 FY2026 earnings call [6].
The watch items follow directly, each a line a reader can check in a future release. Americas organic volume is the single most load-bearing input: the price→volume handoff needs volume to accelerate toward mid-single digits, and the next test is the Q3 FY2026 print. International organic growth, guided to a low-single-digit decline for the full year, needs to turn positive; the German restructuring is scheduled to reach its full $10 million run-rate by the fourth quarter [7]. Free cash flow per share is the reconciler: consensus has it roughly flat, so any acceleration or slippage in available cash flow — year-to-date it was $260.8 million — moves the yield the premium rests on. And the acquisition cadence and leverage — net debt at 1.6 times adjusted EBITDA — will show whether the accelerating program the model ignores is adding value or simply lowering the blended margin.
There is one more tell worth holding. On the July call, with the stock still well below its February high, management said it saw "attractive valuation in our shares" — yet its own outlook deliberately excludes any incremental buyback [8]. Said and did point in the direction the capital chapter already drew: the cash that could shrink the share count is being kept in reserve for deals. A buyer at $158 is paying a margin-based premium for the richest corner of a fragmented industry, and underwriting a forecast in which fading price gives way to a volume rebound, a bought international segment recovers on schedule, and an acquisition program the models decline to credit either earns its keep or gets out of the way. The record says the incumbent team has met more of its commitments than it has missed. The open commitments — all dated, all checkable — sit in the parts of the business the market has seen least.
The numbers behind Allegion plc: as-reported financial statements and company metrics for FY2021–FY2025, traced to the source filings, opened with the share-price history those statements have to justify. Every linked figure opens the exact page of the filing it was printed on, with the statement row highlighted. Amounts in US$ millions unless noted.
Reading notes: Display unit is US$ millions as printed on each statement ('In millions'); per-share and percent rows are exempt from that scale. Main-column years FY2021–FY2025 are each taken from that fiscal year's own Form 10-K consolidated statements. FY2021 income/cash-flow figures come from the FY2021 10-K (which also shows FY2019–FY2020 comparatives used in the Long-Term Record). Revenue by segment and Segment operating income are shown on Allegion's current two-segment basis (Allegion Americas / Allegion International), adopted in the FY2021 10-K. FY2021 and FY2022 use the realigned figures recast in the FY2023 10-K (Note 22) so the whole series is comparable; see discrepancies for the pre-recast feed values. Long-Term Record: FY2019–FY2025 are filing-verified; FY2016–FY2018 total revenue is the sum of reported three-segment net revenues from the data feed (SEC segment history) and is shown without page links, and the other long-term rows are left blank for those years (no filing in the corpus).
Share Price — Available History Since January 2026
The stock closed at $158.14 on Jul 27, 2026 — down 4% over the window shown, trading between $125.65 and $179.77. At that close the stock trades at 21× FY2025 diluted EPS as reported below.
Source: market price feed, daily closes, Jan 2026–Jul 2026 — the feed marks this available history as partial. Price return only, excludes dividends.
Market capitalization $14.0bn and enterprise value $15.6bn.
Market cap = 88.3M shares outstanding × the Jul 27, 2026 close of $158.14. Enterprise value adds total debt of $2.0bn and subtracts cash and equivalents of $356mn (net debt of $1.6bn), from the FY2025 balance sheet. Market-derived figures, shown without filing links.
FY2025 at a Glance
Operating income (US$ millions)
Diluted EPS
Source: FY2025 consolidated statements [1] [2] [3] [4]. Click any linked figure to open the filing page with the row highlighted.
Net Revenues by Segment
| Net Revenues by Segment | FY2021 | FY2022 | FY2023 | FY2024 | FY2025 |
|---|---|---|---|---|---|
| Allegion Americas | 2,050 | 2,531 | 2,914 | 3,012 | 3,219 |
| Allegion International | 817 | 741 | 737 | 760 | 848 |
| Total net revenues | 2,867 | 3,272 | 3,651 | 3,772 | 4,067 |
| Total net revenues growth, derived | — | +14.1% | +11.6% | +3.3% | +7.8% |
Source: Note 22 – Business Segment Information (reportable-segment net revenues); FY2021–FY2022 on the recast two-segment basis presented in the FY2023 Form 10-K [5] [1] [2] [6]. Click any linked figure to open the filing page with the row highlighted.
Segment Operating Income
| Segment Operating Income | FY2021 | FY2022 | FY2023 | FY2024 | FY2025 |
|---|---|---|---|---|---|
| Allegion Americas | 524 | 611 | 757 | 816 | 896 |
| Allegion Americas segment operating margin | 25.5% | 24.2% | 26.0% | 27.1% | 27.9% |
| Allegion International | 84 | 70 | 58 | 66 | 76 |
| Allegion International segment operating margin | 10.3% | 9.5% | 7.9% | 8.7% | 9.0% |
| Segment operating income from reportable segments | 607 | 682 | 815 | 882 | 973 |
Source: Note 22 – Business Segment Information (Segment operating income and margin) [5] [6]. Click any linked figure to open the filing page with the row highlighted.
Income Statement
Source: Consolidated Statements of Comprehensive Income [1] [2] [3] [4]. Click any linked figure to open the filing page with the row highlighted.
Columns marked E are consensus analyst estimates from S&P Capital IQ (CapIQ), shown alongside reported results for direct comparison; they are not company guidance.
Estimate source: S&P Capital IQ (CapIQ) consensus, as of 2026-07-27. Estimate figures are S&P Capital IQ consensus (vendor data — no filing page links). EPS and net income use the normalized (adjusted) consensus where the street reports it. Line-item analyst models (segments, drivers, KPIs) are in the Visible Alpha tab.
Balance Sheet
Source: Consolidated Balance Sheets [7] [8] [9] [10]. Click any linked figure to open the filing page with the row highlighted.
Cash Flow
Source: Consolidated Statements of Cash Flows [11] [12] [13] [14]. Click any linked figure to open the filing page with the row highlighted.
Revenue Growth Drivers (YoY %)
| Revenue Growth Drivers (YoY %) | FY2021 | FY2022 | FY2023 | FY2024 | FY2025 |
|---|---|---|---|---|---|
| Pricing | 1.8% | 9.8% | 7.5% | 2.4% | 3.1% |
| Volume | 2.7% | 0.9% | (2.3%) | (0.3%) | 1.0% |
| Acquisitions / divestitures | (0.5%) | 6.4% | 6.2% | 1.3% | 3.1% |
| Currency exchange rates | 1.4% | (3.0%) | 0.2% | (0.1%) | 0.6% |
| Total reported revenue growth | 5.4% | 14.1% | 11.6% | 3.3% | 7.8% |
Source: company filings [15] [16] [17] [18]. Click any linked figure to open the filing page with the row highlighted.
Cash Flow, Leverage Dividends
| Cash Flow, Leverage Dividends | FY2021 | FY2022 | FY2023 | FY2024 | FY2025 |
|---|---|---|---|---|---|
| Available cash flow | 443 | 396 | 516 | 583 | 686 |
| Net debt / adjusted EBITDA (year-end) | 1.7 | 2.5 | 1.9 | 1.6 | 1.6 |
| Dividend declared per ordinary share (quarterly rate) | 0.36 | 0.41 | 0.45 | 0.48 | 0.51 |
Source: company filings [19] [20] [21] [22]. Click any linked figure to open the filing page with the row highlighted.
R D, Workforce Tax
| R D, Workforce Tax | FY2021 | FY2022 | FY2023 | FY2024 | FY2025 |
|---|---|---|---|---|---|
| Research and development expense | 73 | 74 | 102 | 113 | 132 |
| Employees (approximate, worldwide) | 11,000 | 12,300 | 12,400 | 14,400 | 13,300 |
| Effective tax rate | 7.8% | 10.9% | 12.4% | 14.5% | 16.2% |
Source: company filings [23] [24] [25] [26]. Click any linked figure to open the filing page with the row highlighted.
Long-Term Record
| Fiscal year | Total revenue | Operating income | Net income | Diluted EPS | Operating cash flow |
|---|---|---|---|---|---|
| FY2016 | 2,238 | — | — | — | — |
| FY2017 | 2,408 | — | — | — | — |
| FY2018 | 2,732 | — | — | — | — |
| FY2019 | 2,854 | 565 | 402 | 4.26 | 488 |
| FY2020 | 2,720 | 404 | 314 | 3.39 | 490 |
| FY2021 | 2,867 | 530 | 483 | 5.34 | 489 |
| FY2022 | 3,272 | 586 | 458 | 5.19 | 460 |
| FY2023 | 3,651 | 708 | 540 | 6.12 | 601 |
| FY2024 | 3,772 | 781 | 598 | 6.82 | 675 |
| FY2025 | 4,067 | 860 | 644 | 7.44 | 784 |
Source: consolidated statements across filings; older years from the standardized feed [11] [1] [12] [2]. Click any linked figure to open the filing page with the row highlighted.
Analyst Consensus
Mean target
Median target
High target
Low target
Street ratings: 4 strong buy, 1 buy, 6 hold. Consensus: Buy.
Estimate source: S&P Capital IQ (CapIQ) consensus, as of 2026-07-27. Estimate figures are S&P Capital IQ consensus (vendor data — no filing page links). EPS and net income use the normalized (adjusted) consensus where the street reports it. Line-item analyst models (segments, drivers, KPIs) are in the Visible Alpha tab.
Traceability
439 of 442 figures on this page (99%) link to the filing page where they are printed — click a linked figure to open the source PDF at that page with the row highlighted. Unlinked figures come from standardized data feeds or pre-filing years.
Display unit is US$ millions as printed on each statement ('In millions'); per-share and percent rows are exempt from that scale.
Main-column years FY2021–FY2025 are each taken from that fiscal year's own Form 10-K consolidated statements. FY2021 income/cash-flow figures come from the FY2021 10-K (which also shows FY2019–FY2020 comparatives used in the Long-Term Record).
Revenue by segment and Segment operating income are shown on Allegion's current two-segment basis (Allegion Americas / Allegion International), adopted in the FY2021 10-K. FY2021 and FY2022 use the realigned figures recast in the FY2023 10-K (Note 22) so the whole series is comparable; see discrepancies for the pre-recast feed values.
Long-Term Record: FY2019–FY2025 are filing-verified; FY2016–FY2018 total revenue is the sum of reported three-segment net revenues from the data feed (SEC segment history) and is shown without page links, and the other long-term rows are left blank for those years (no filing in the corpus).
Total equity rows use the printed 'Total equity' line (including noncontrolling interests where present): FY2022 $944.5M includes $2.7M NCI (Allegion shareholders' equity was $941.8M, the figure the feed reports).
Quarterly block: income statement and balance sheet are taken directly from the quarterly earnings-release statements (three-months-ended and period-end columns). Quarterly cash flows are single quarters derived from the printed year-to-date statements and reconcile exactly to the data feed's quarterly cash-flow values where available (Q2 FY25 onward).
6 figure(s) differed between the data feed and the filing; the filing value is shown (see the run's metrics/metrics_tab.json for the audit trail).
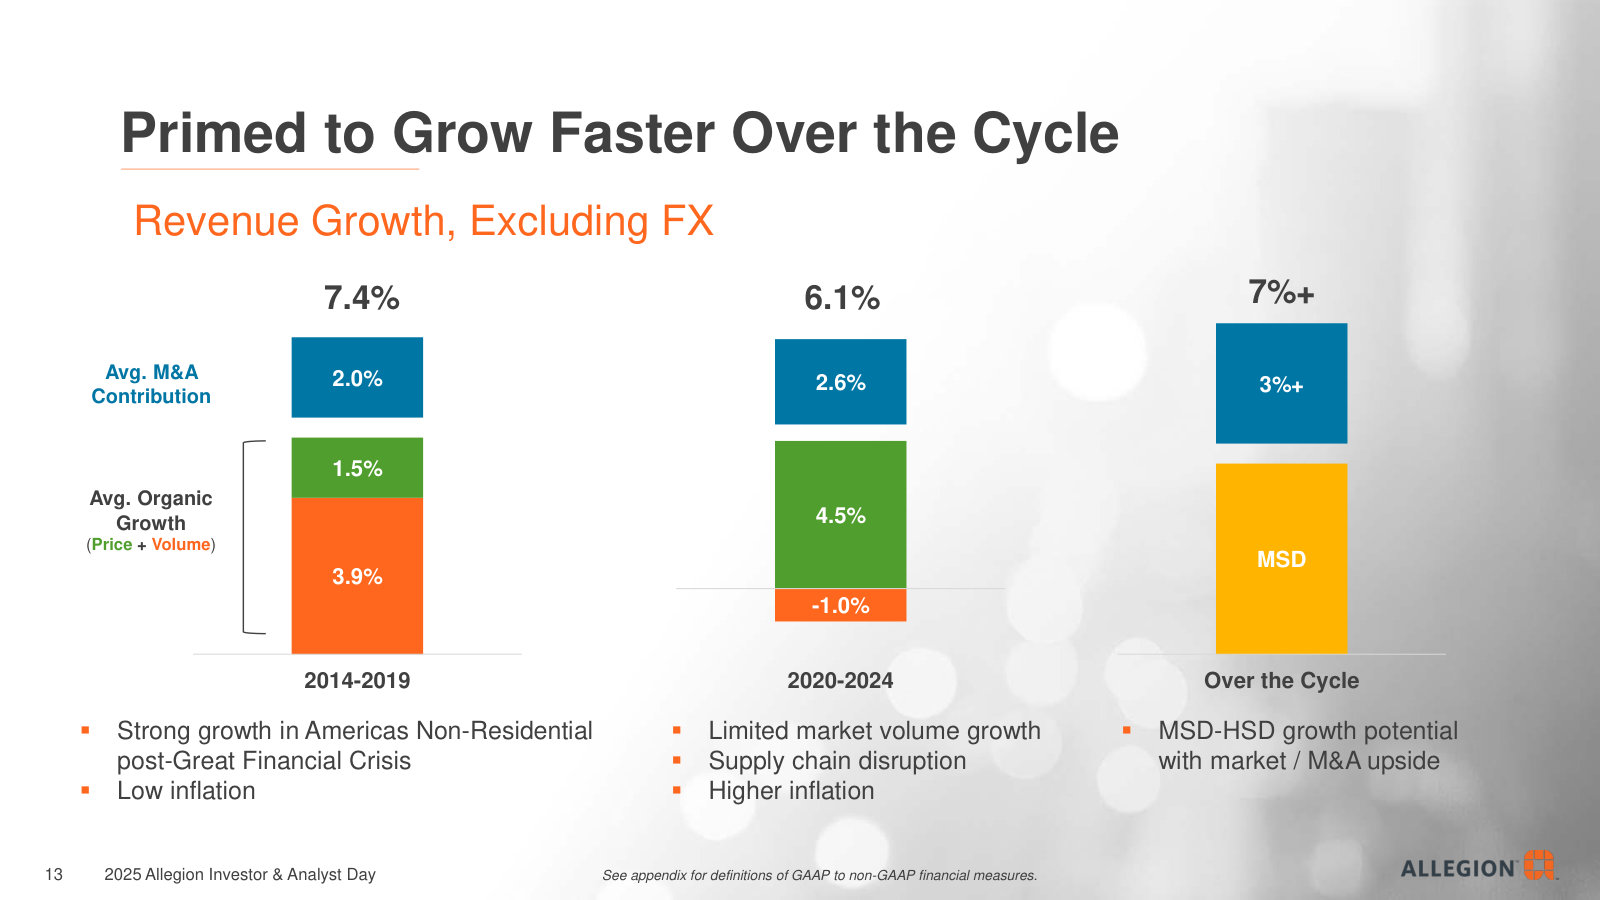
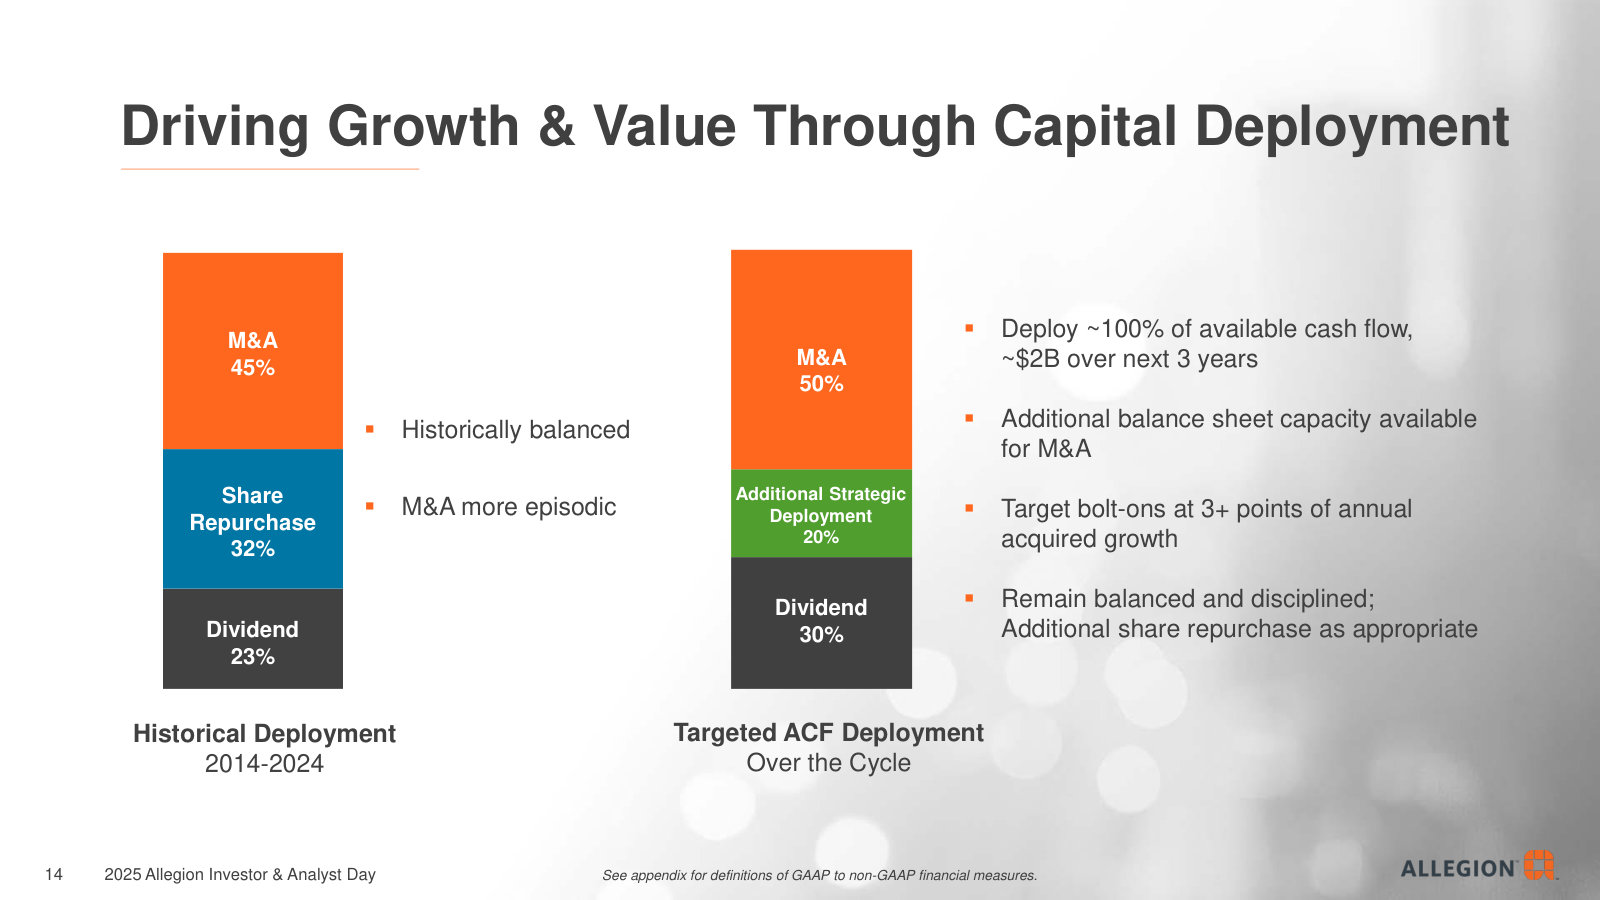
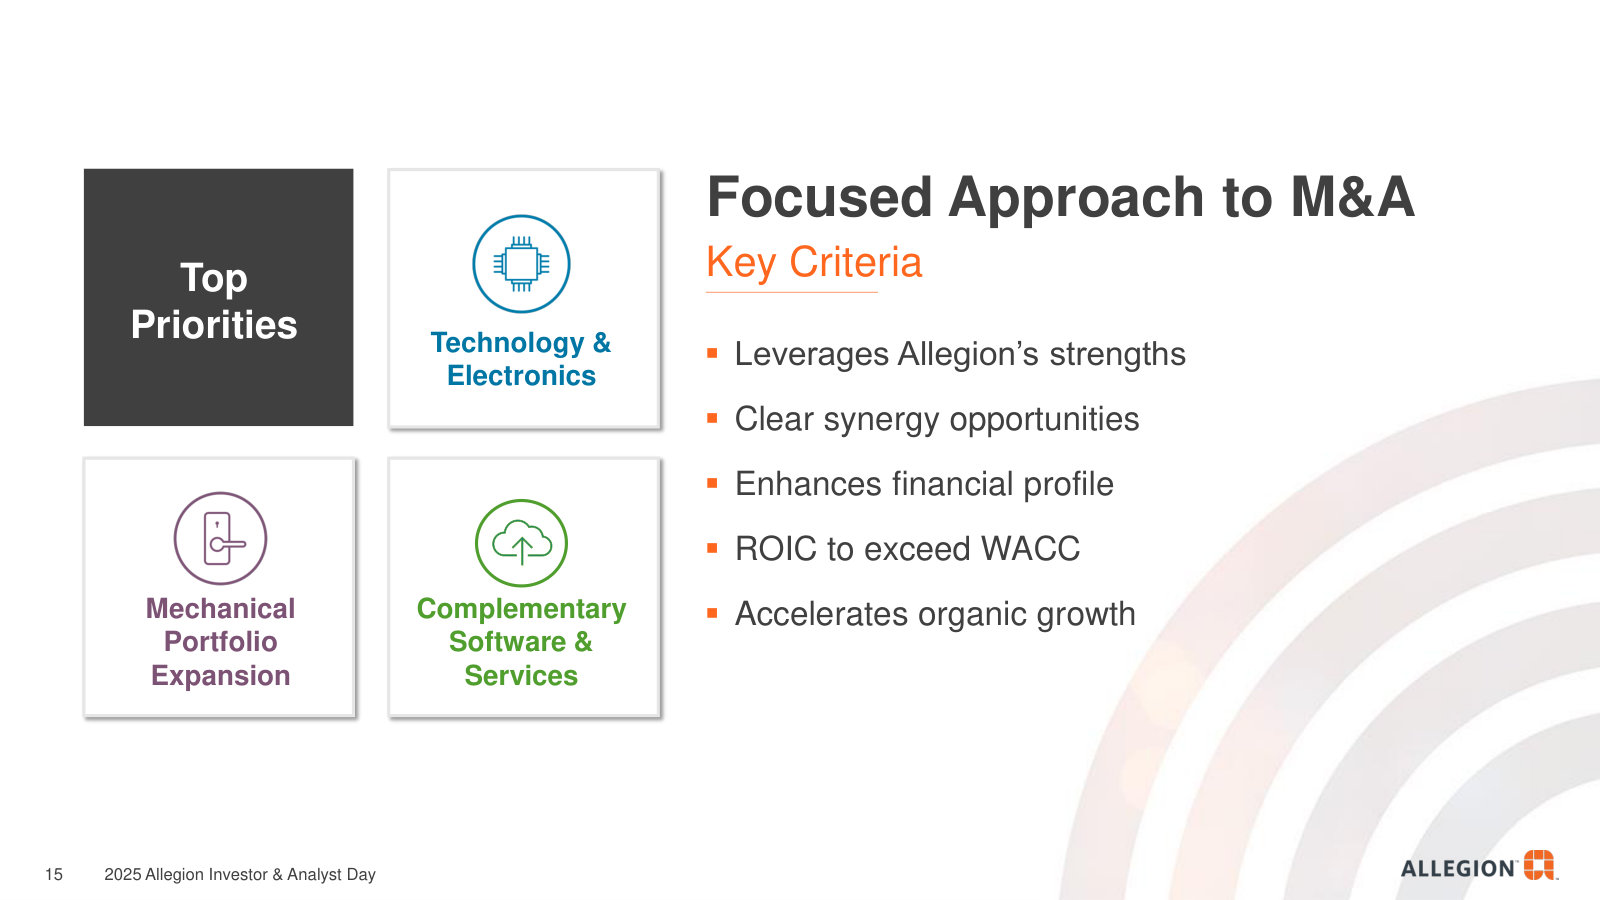
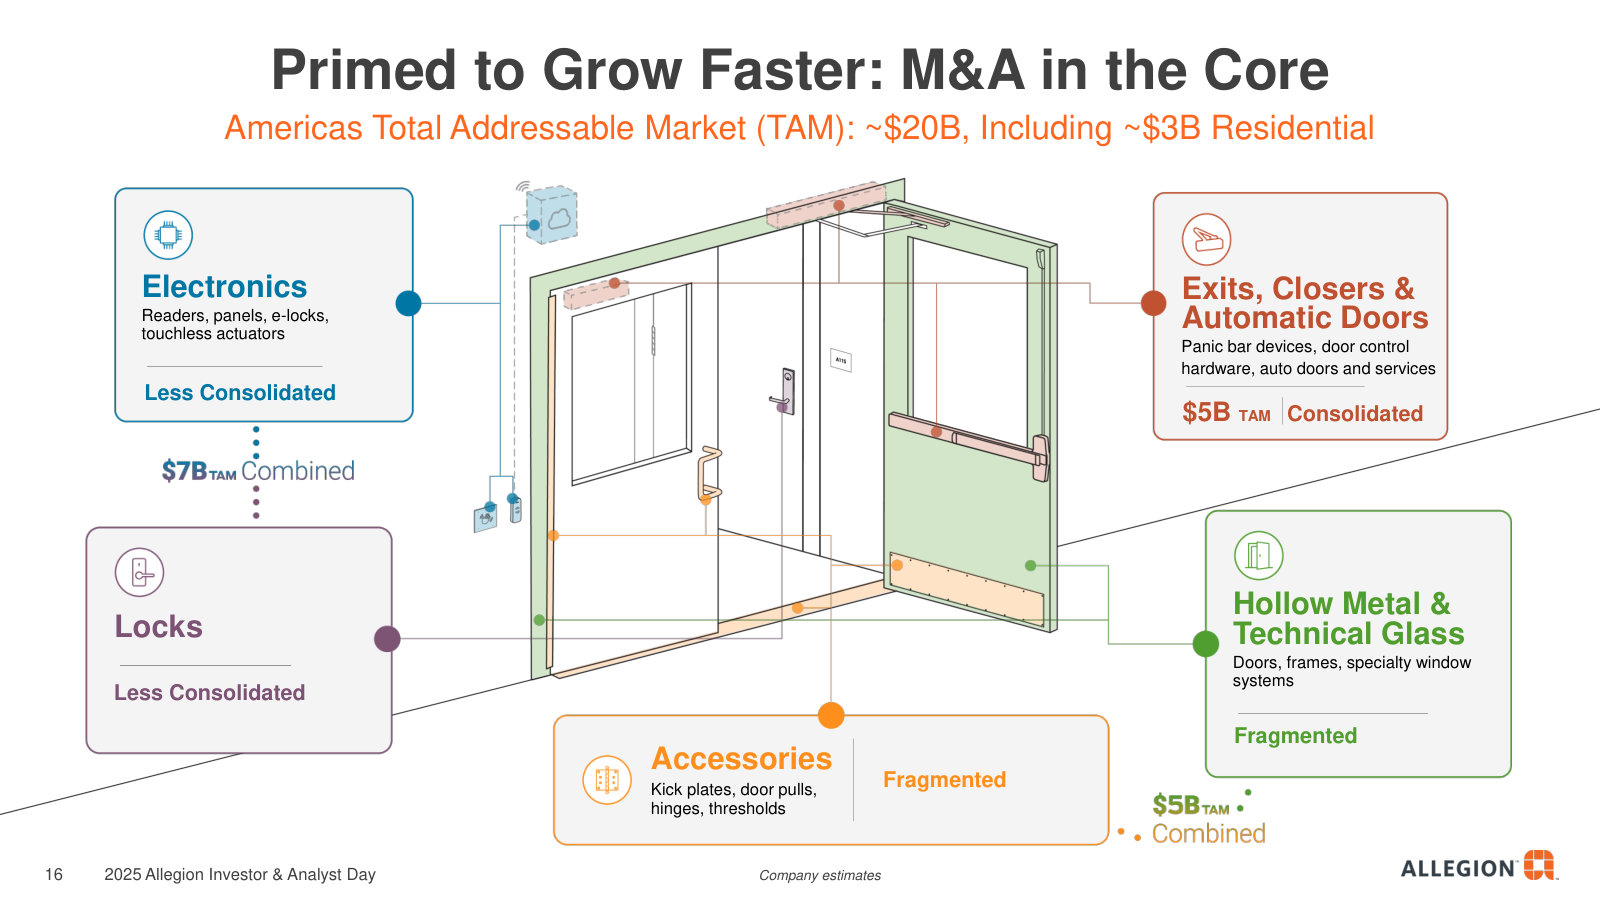
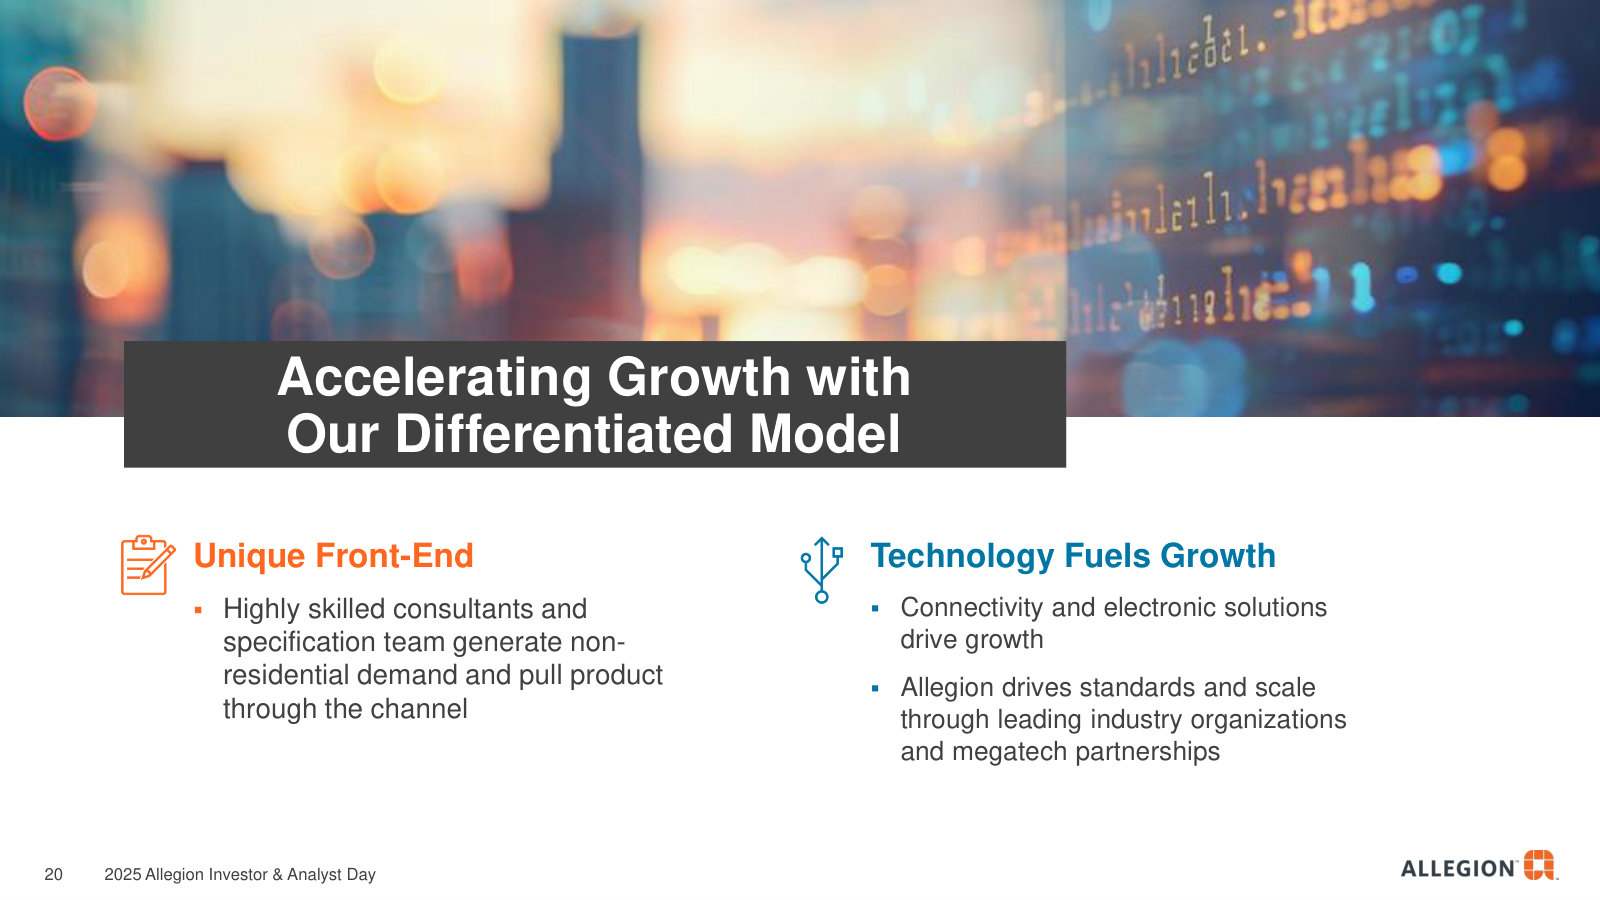
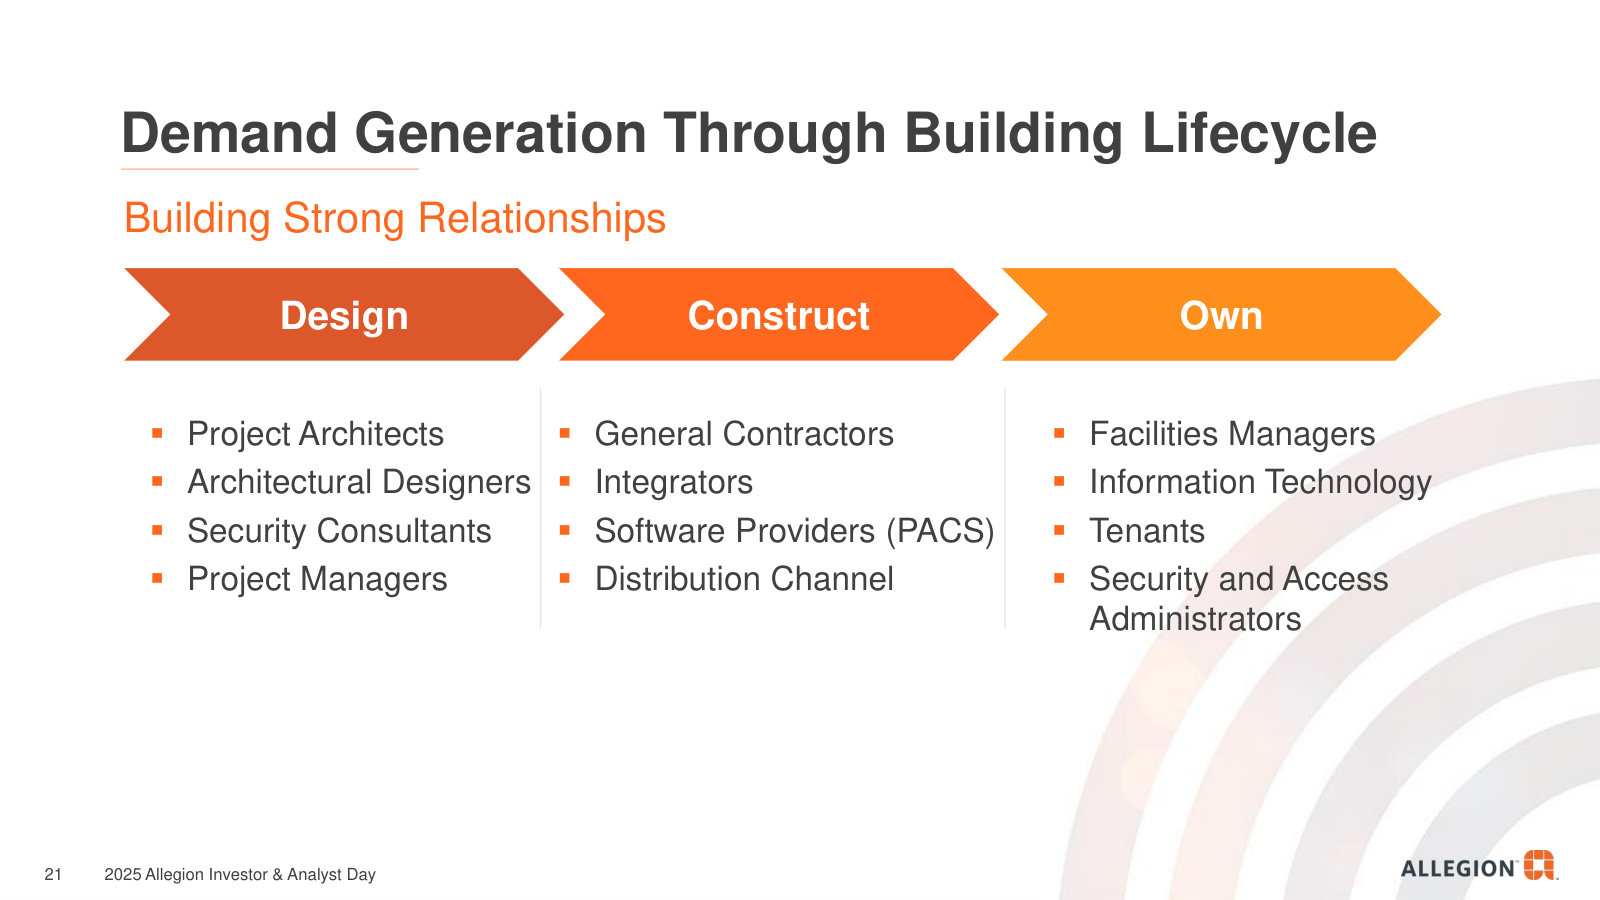
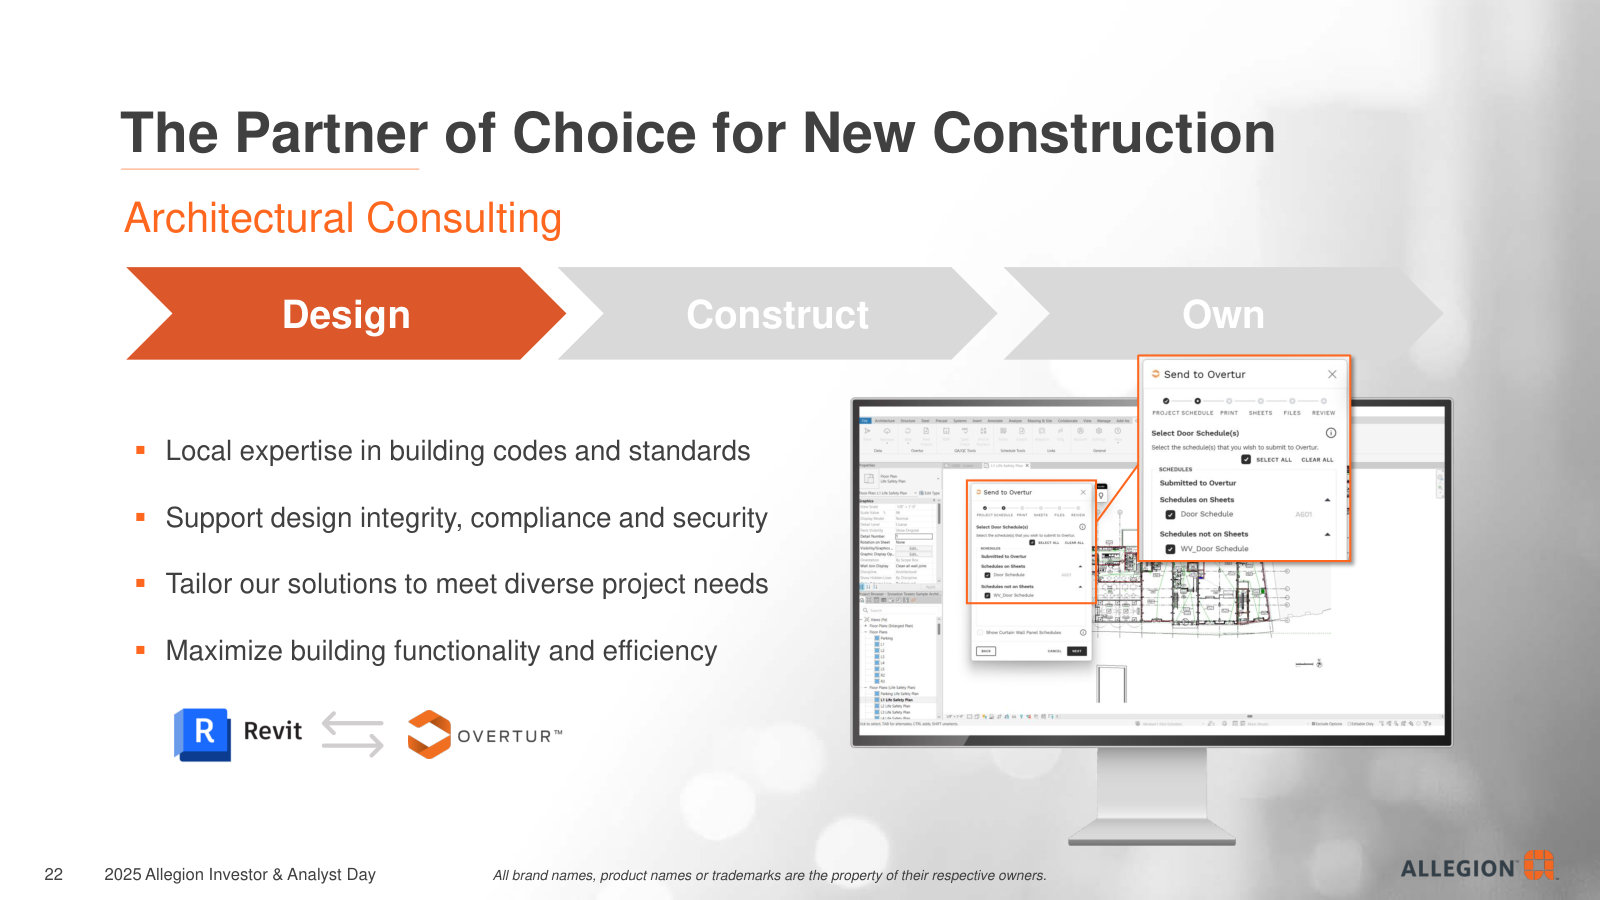
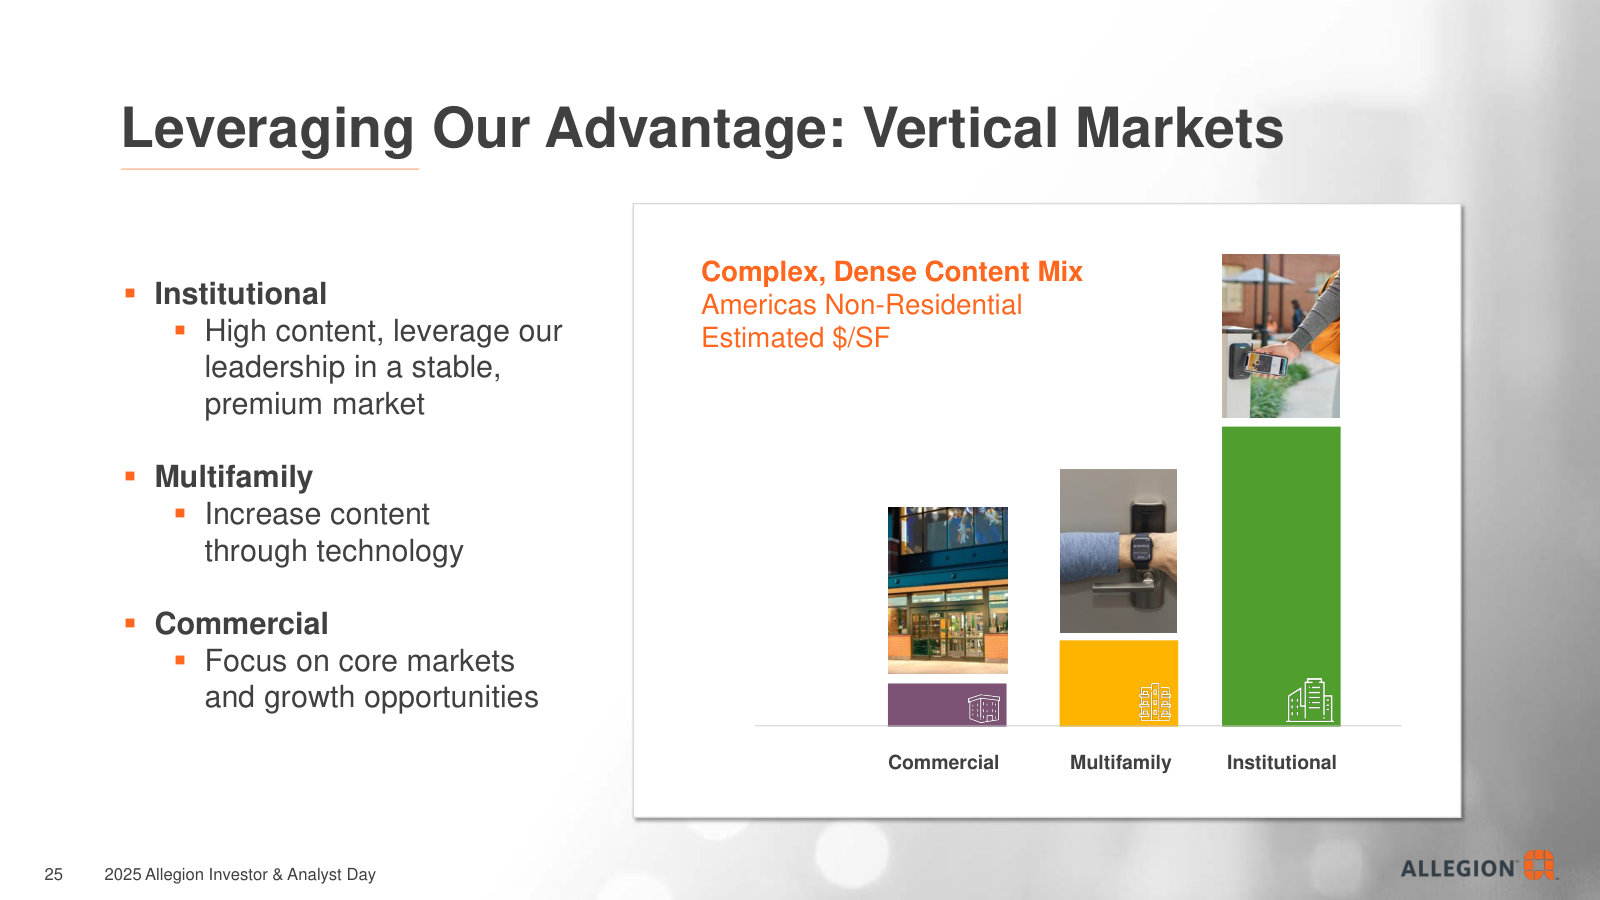
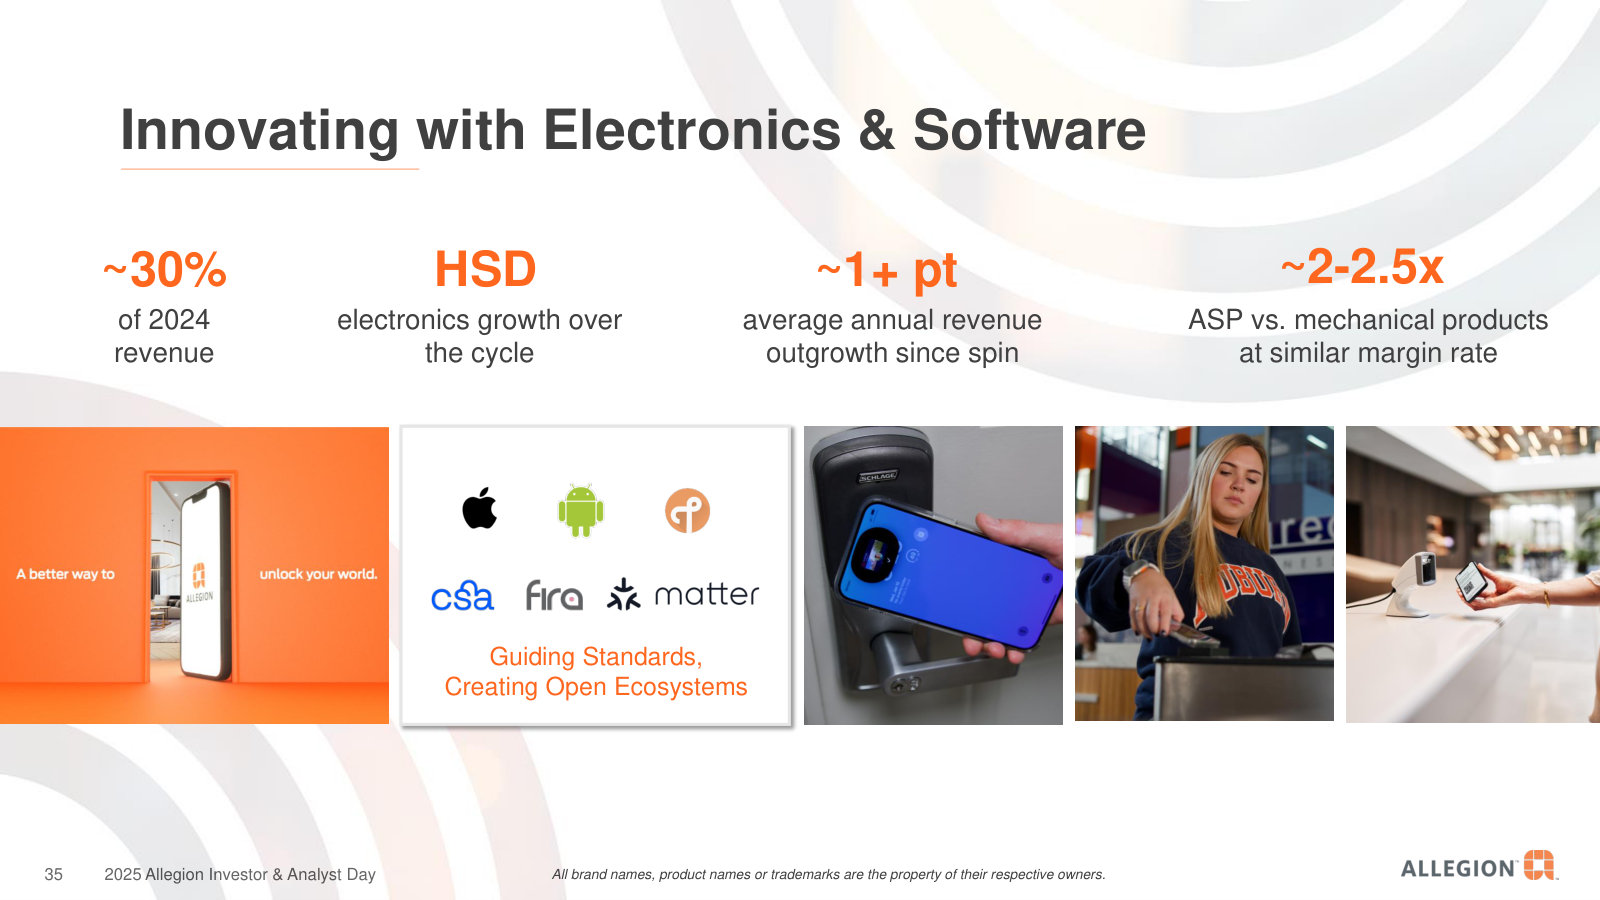
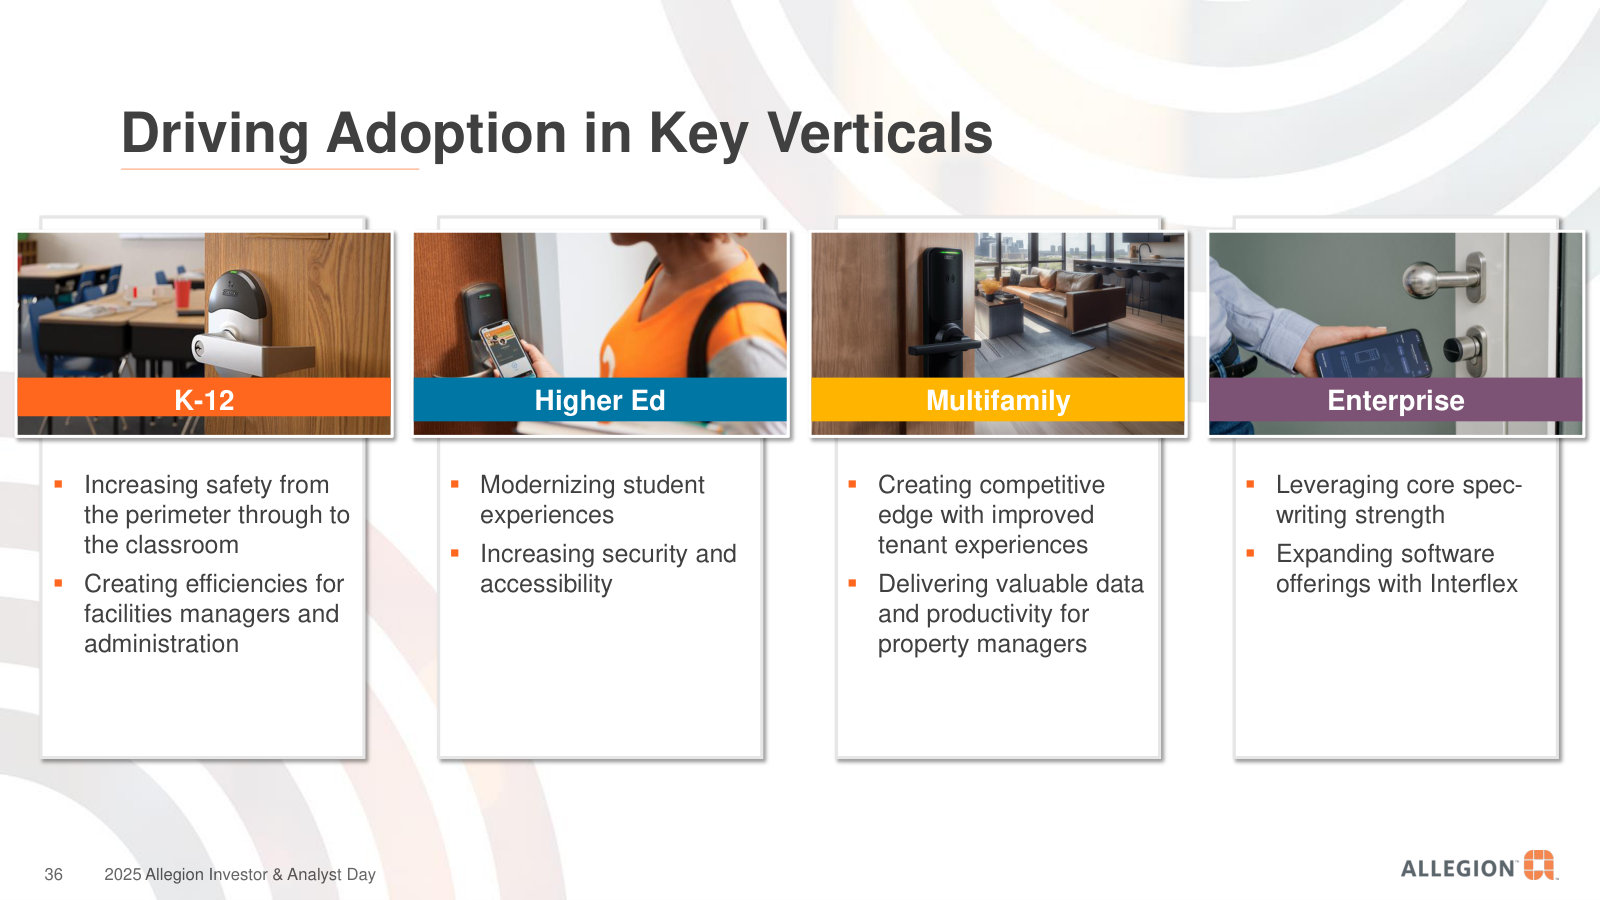
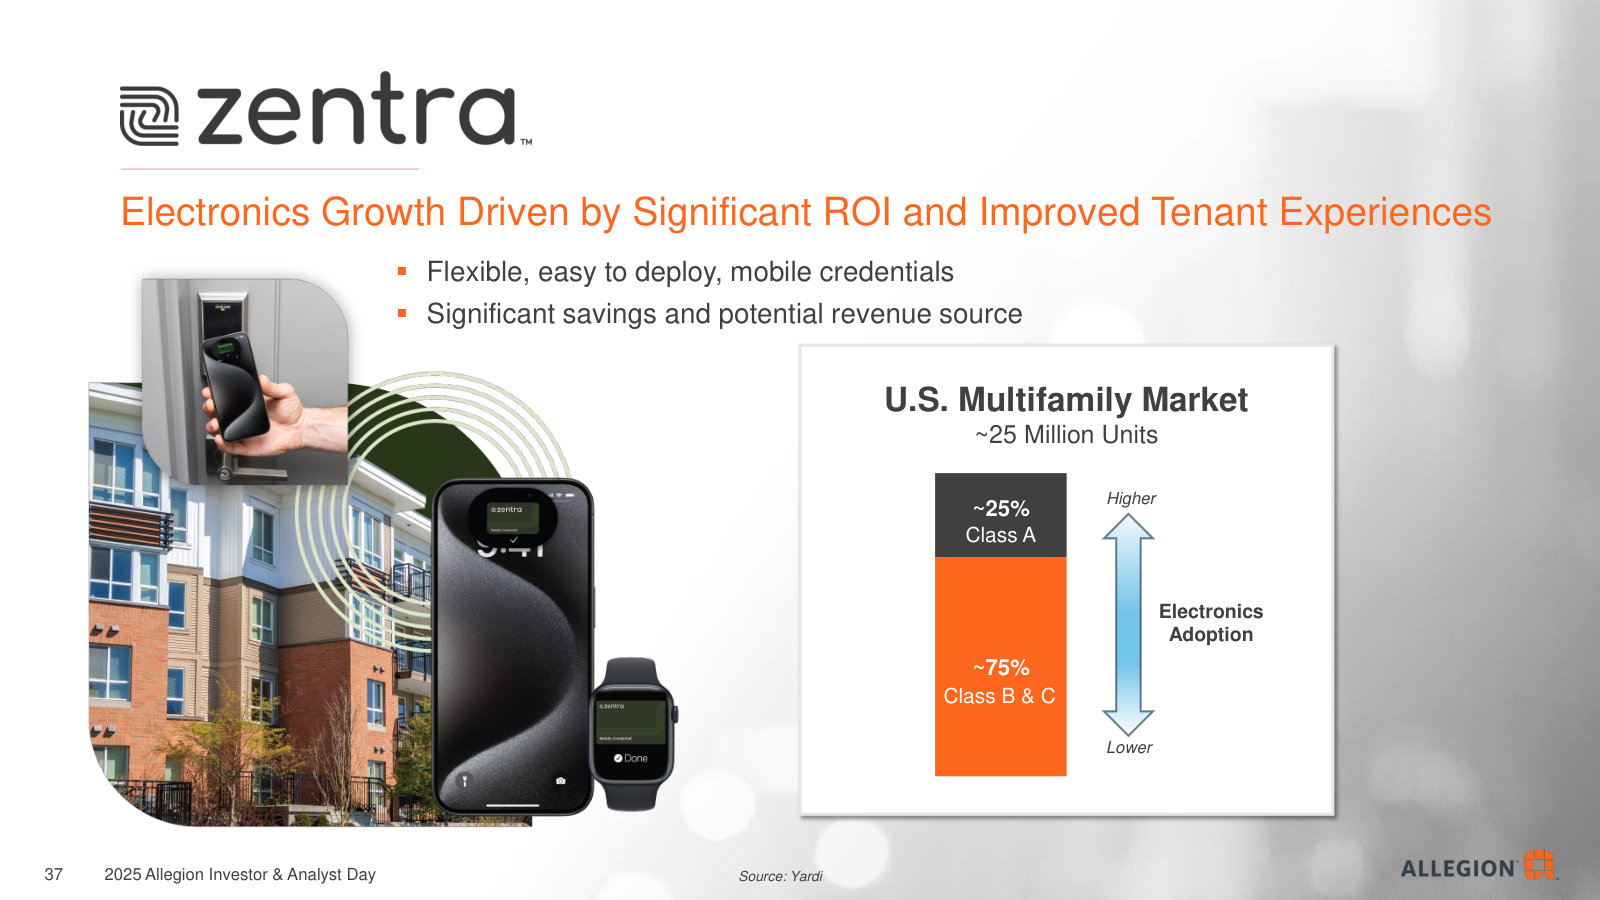
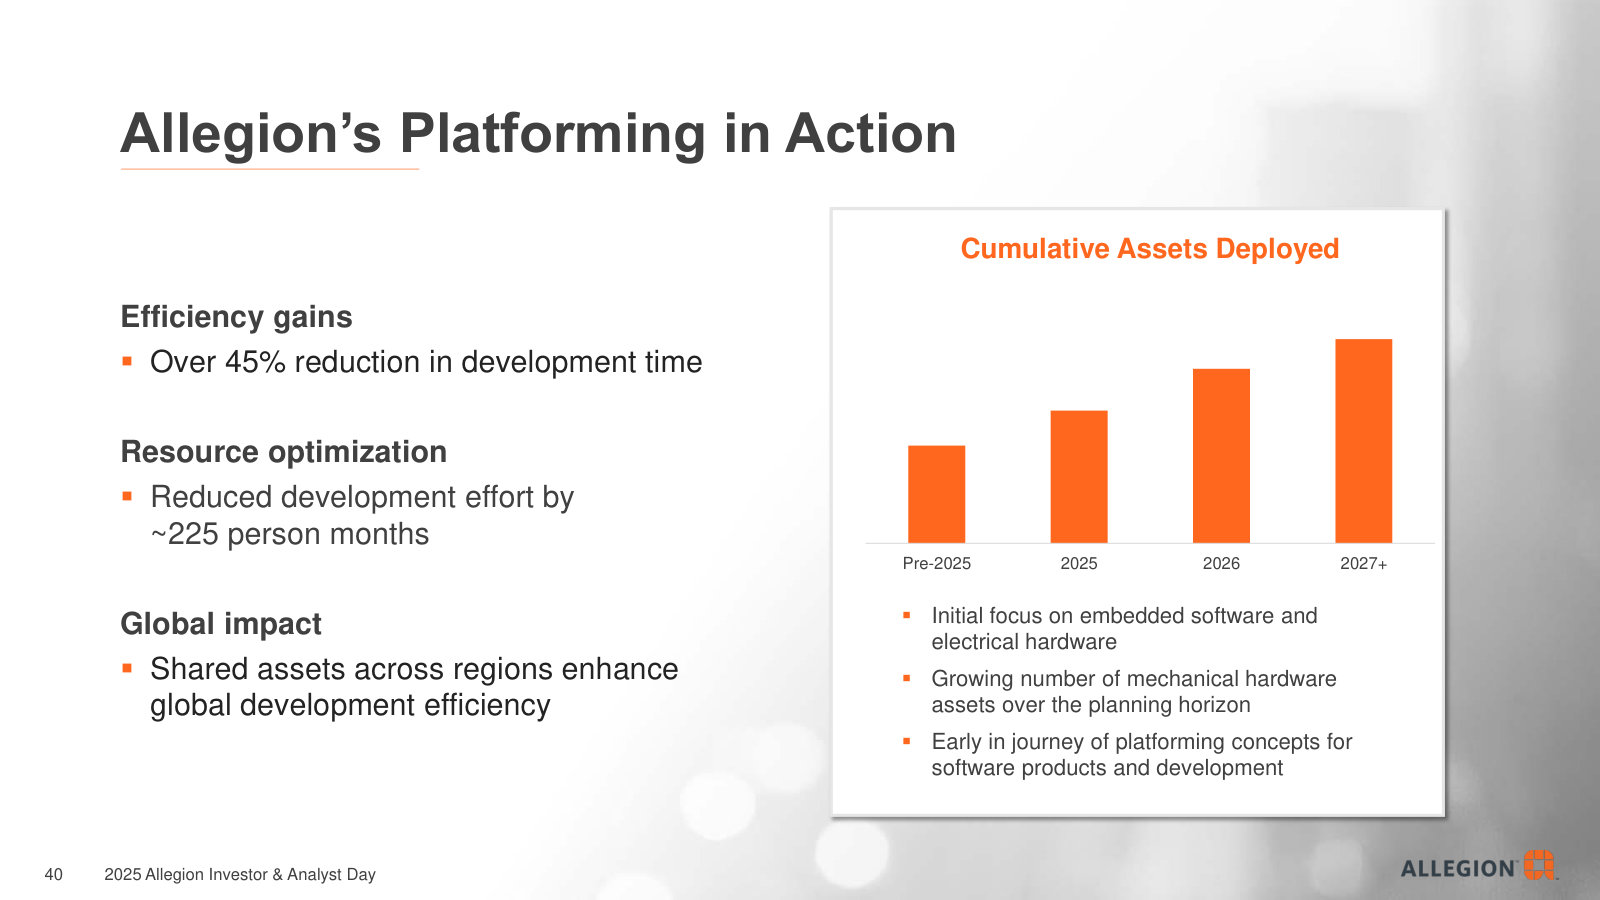
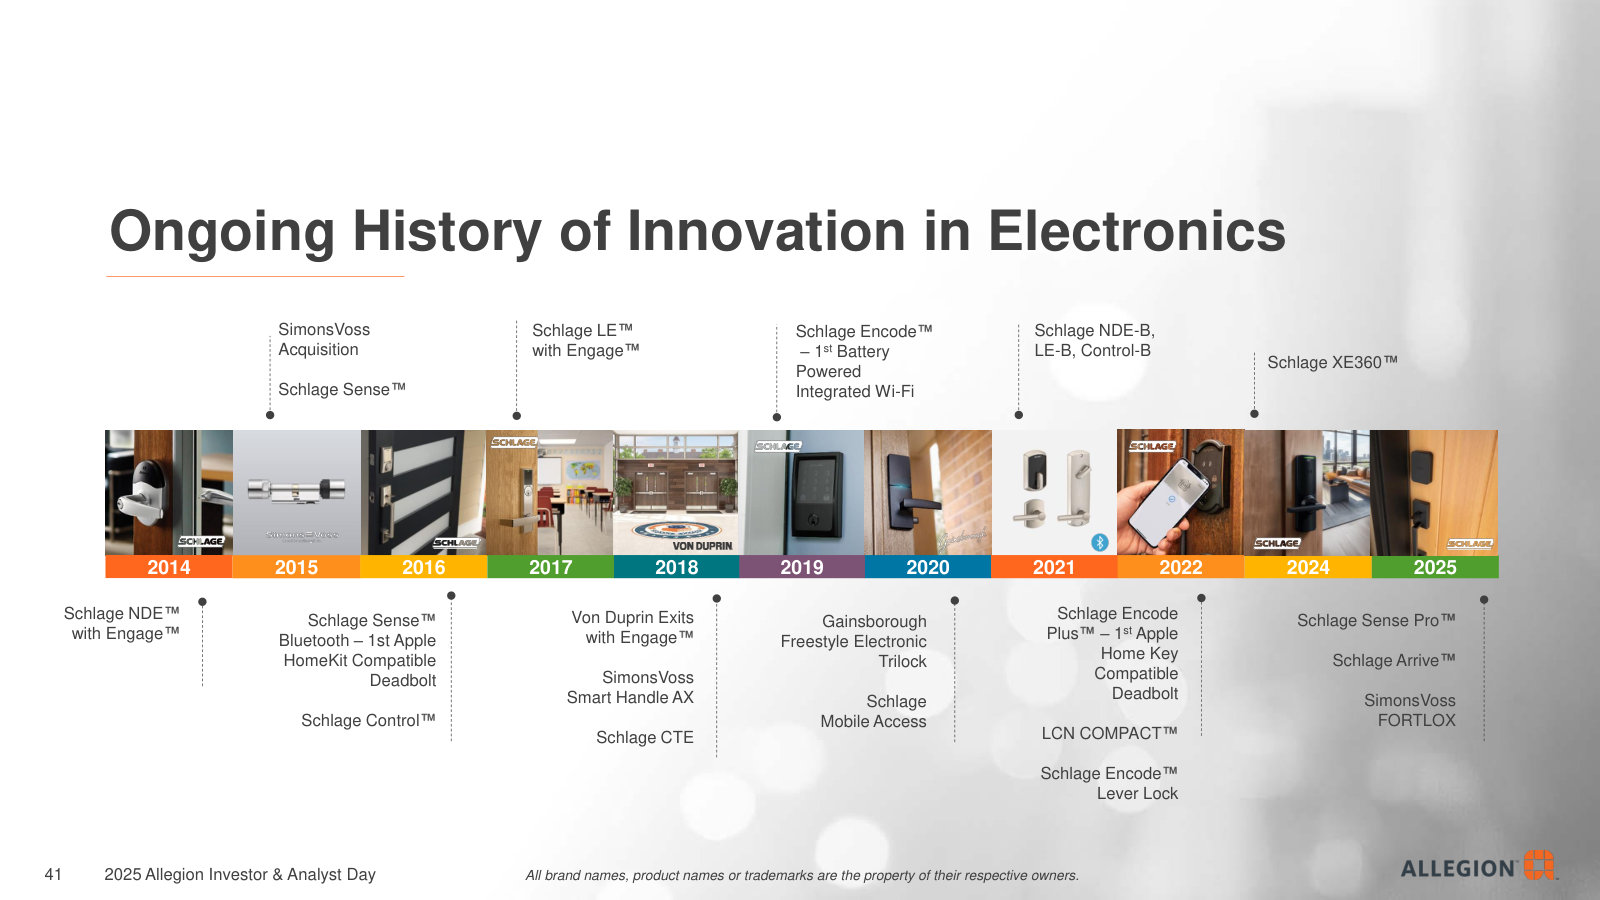
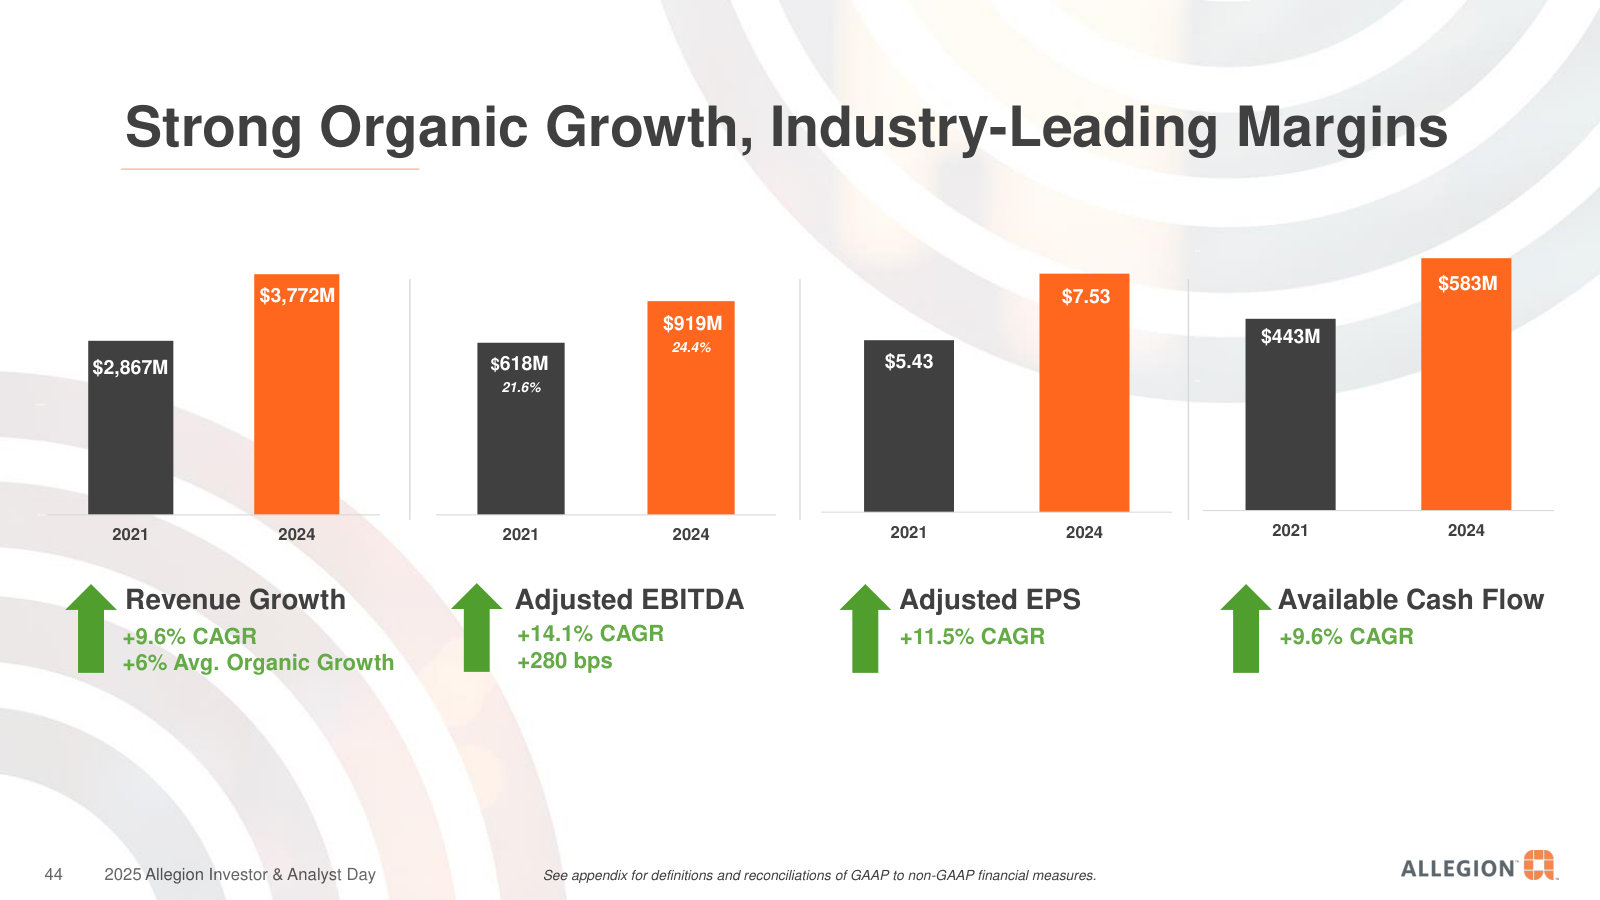
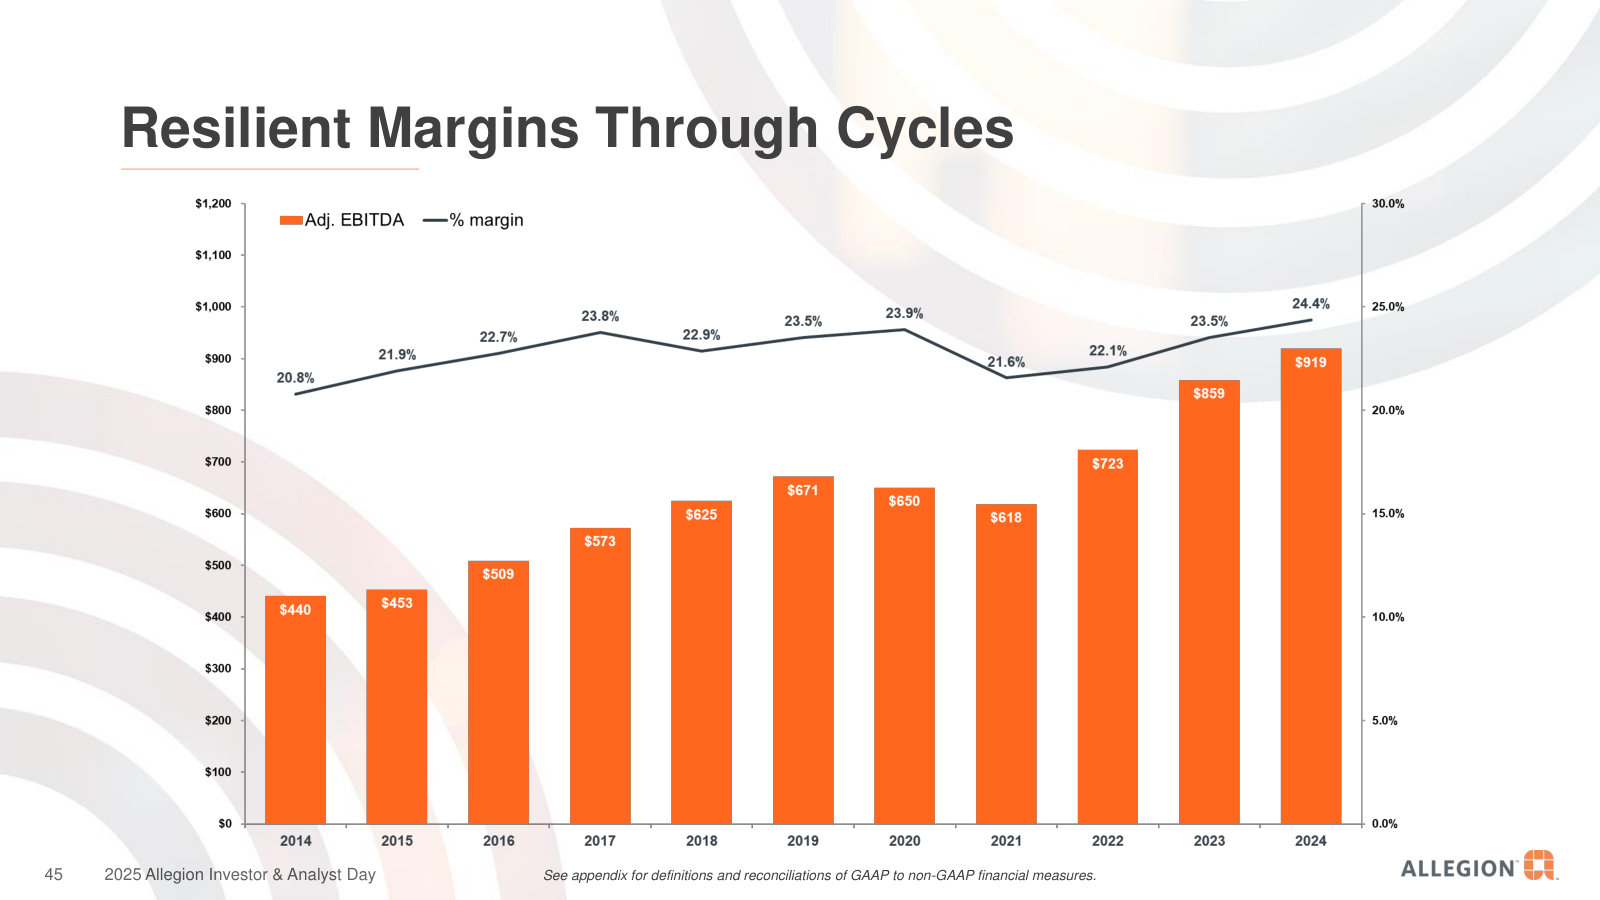
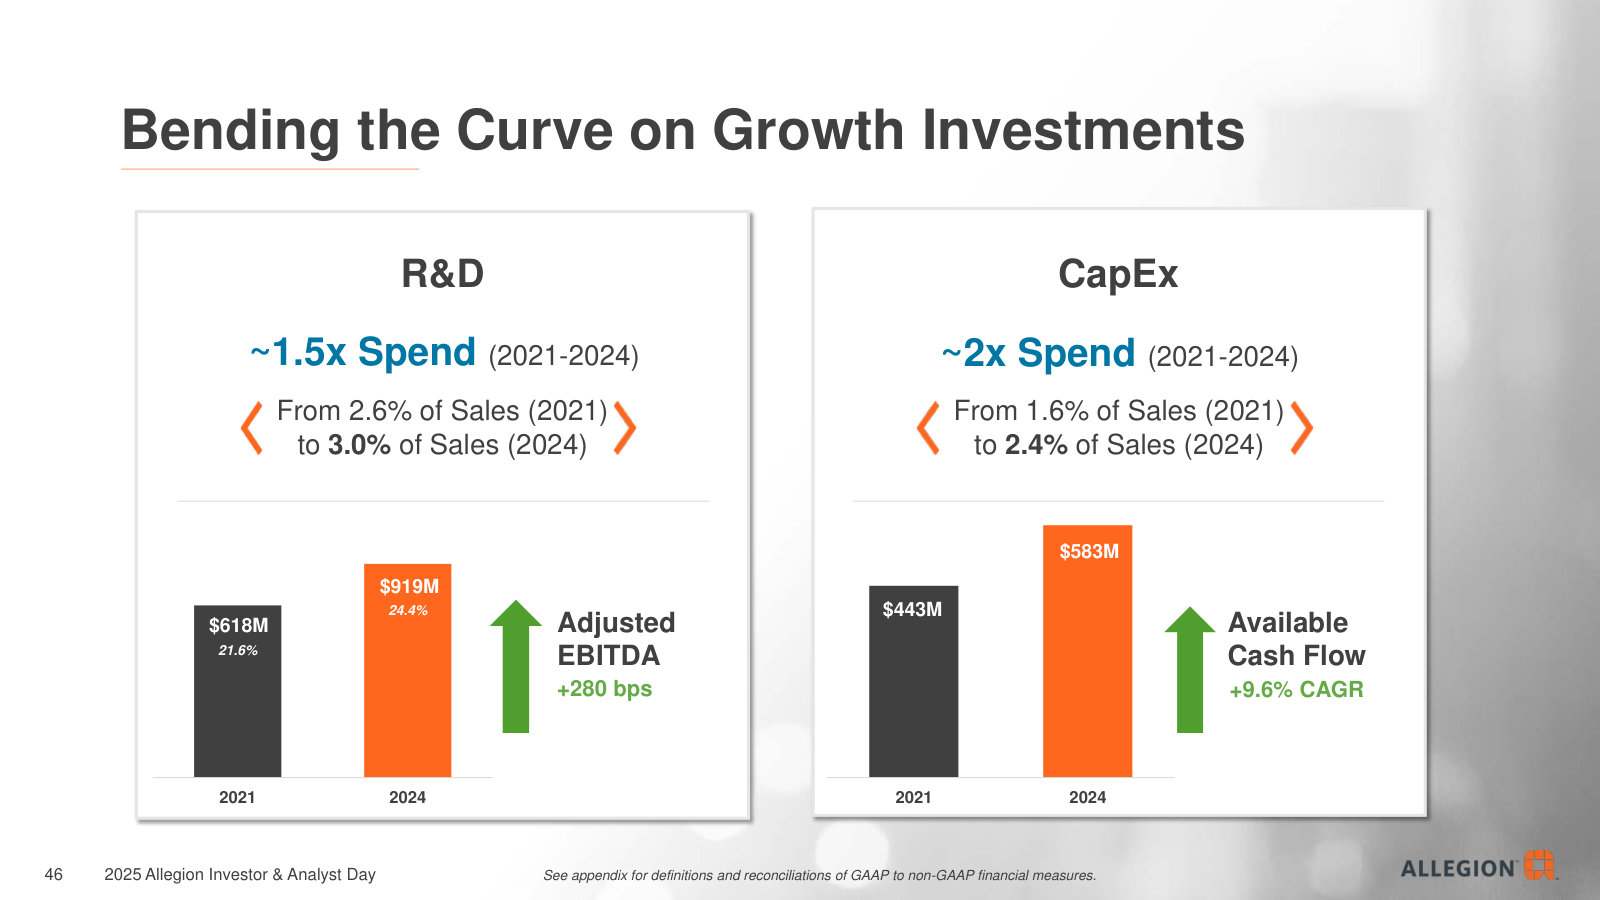
Allegion plc's management explains the business in its own materials. The slides below do the most of that work, pulled from the documents preserved in Sources. Each source link opens the complete presentation at that slide in a new tab.
Investor & Analyst Day 2025 — 2025
Management's fullest statement of strategy, business model, segment economics and capital allocation — the fastest path to knowing Allegion. · Open the full document →
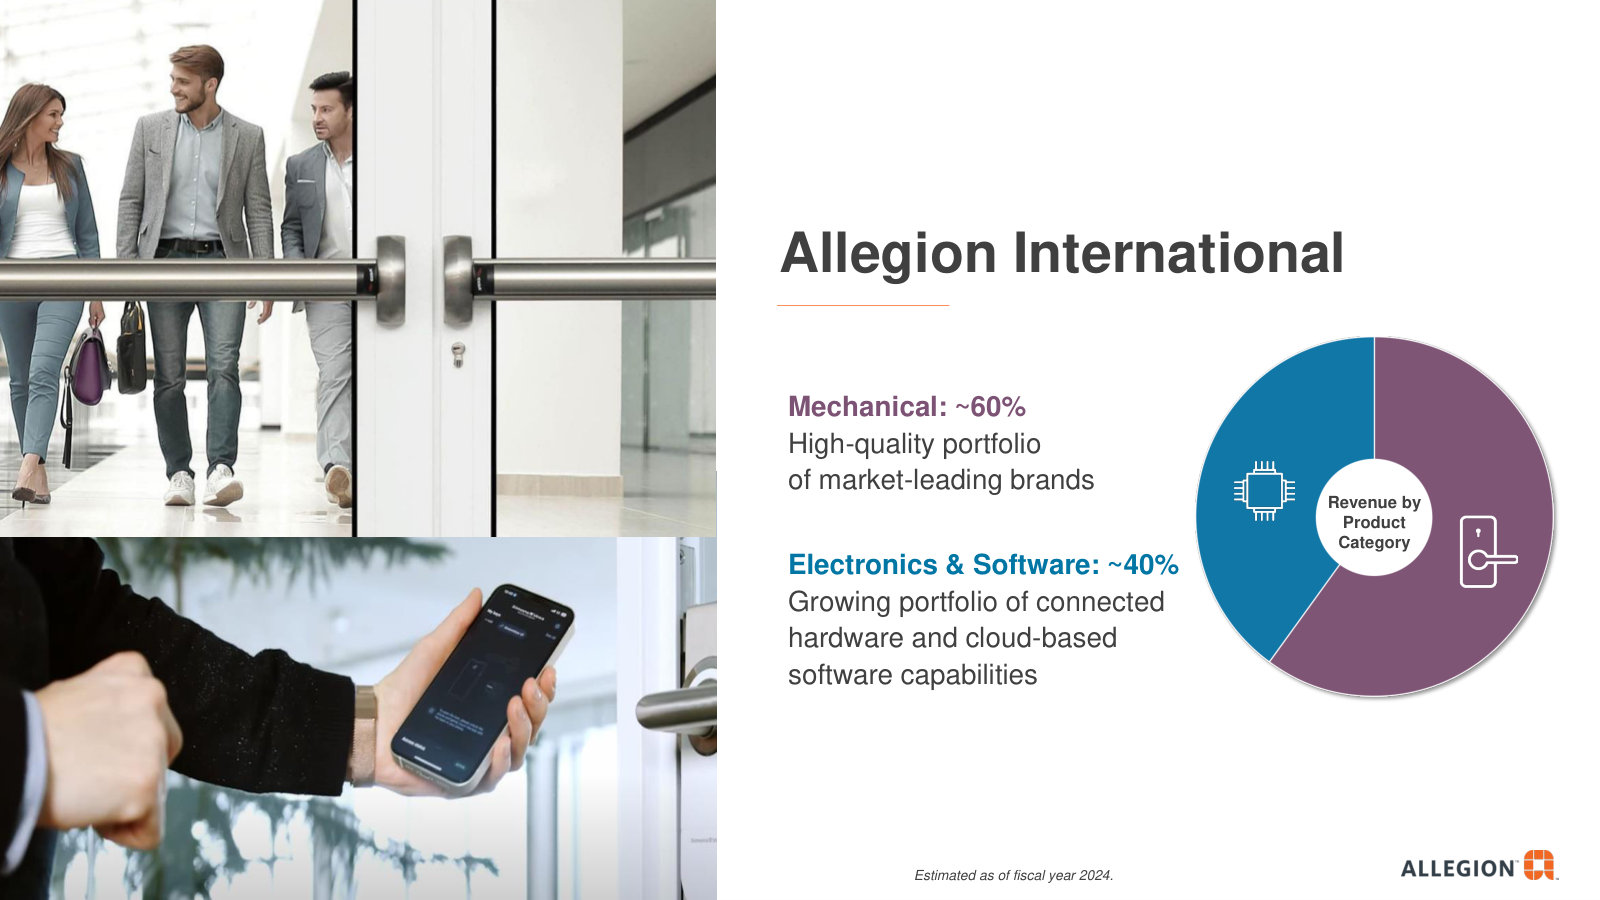
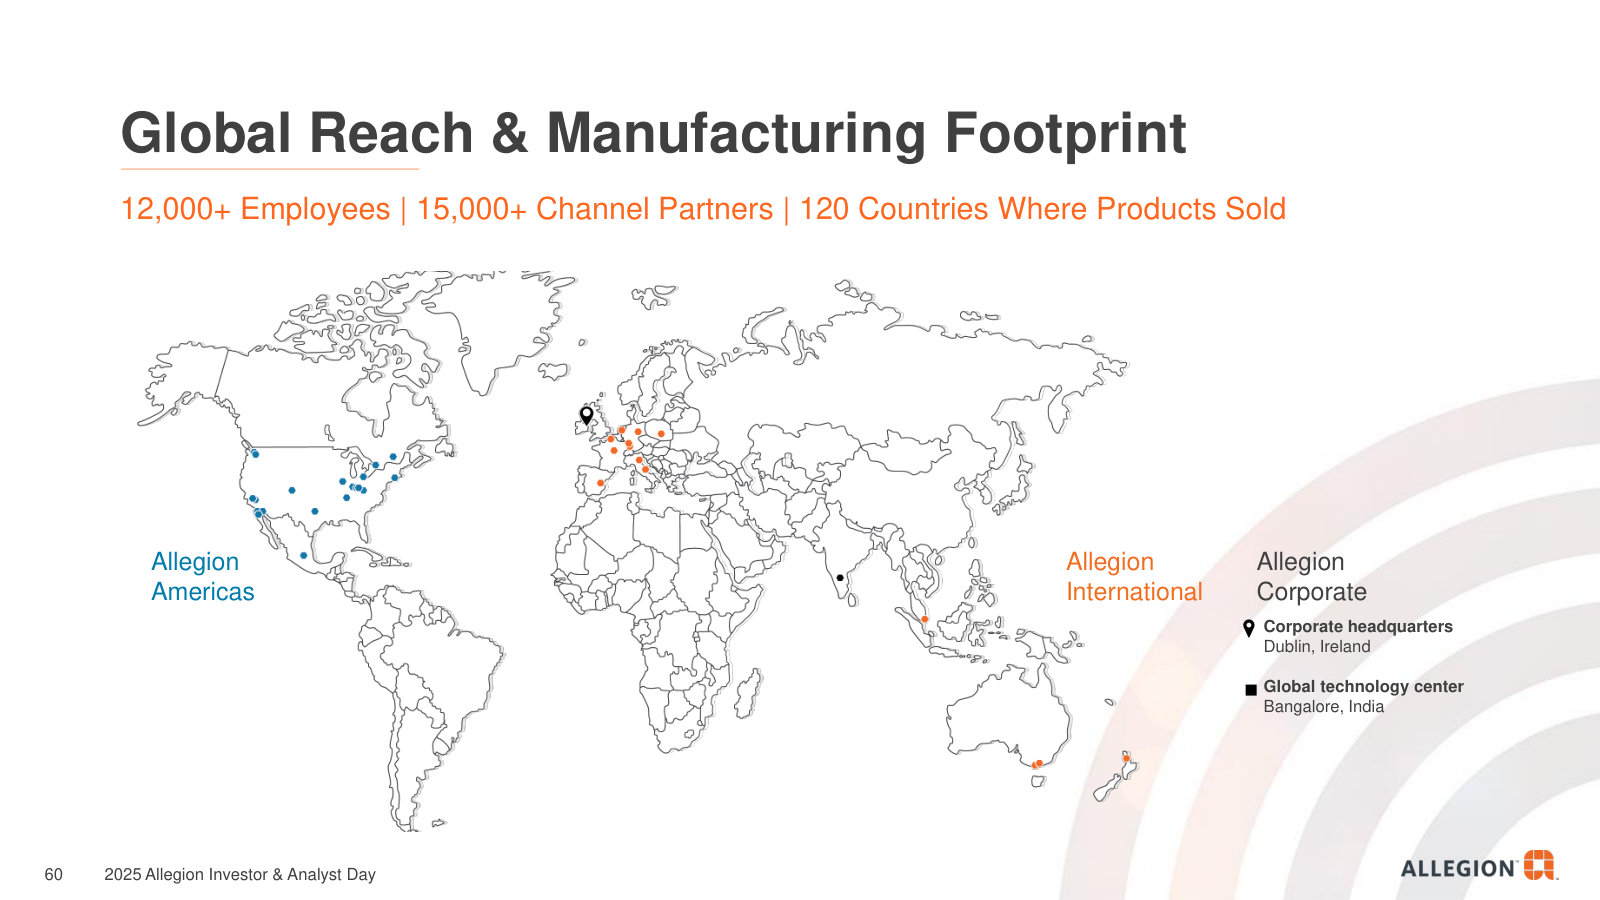
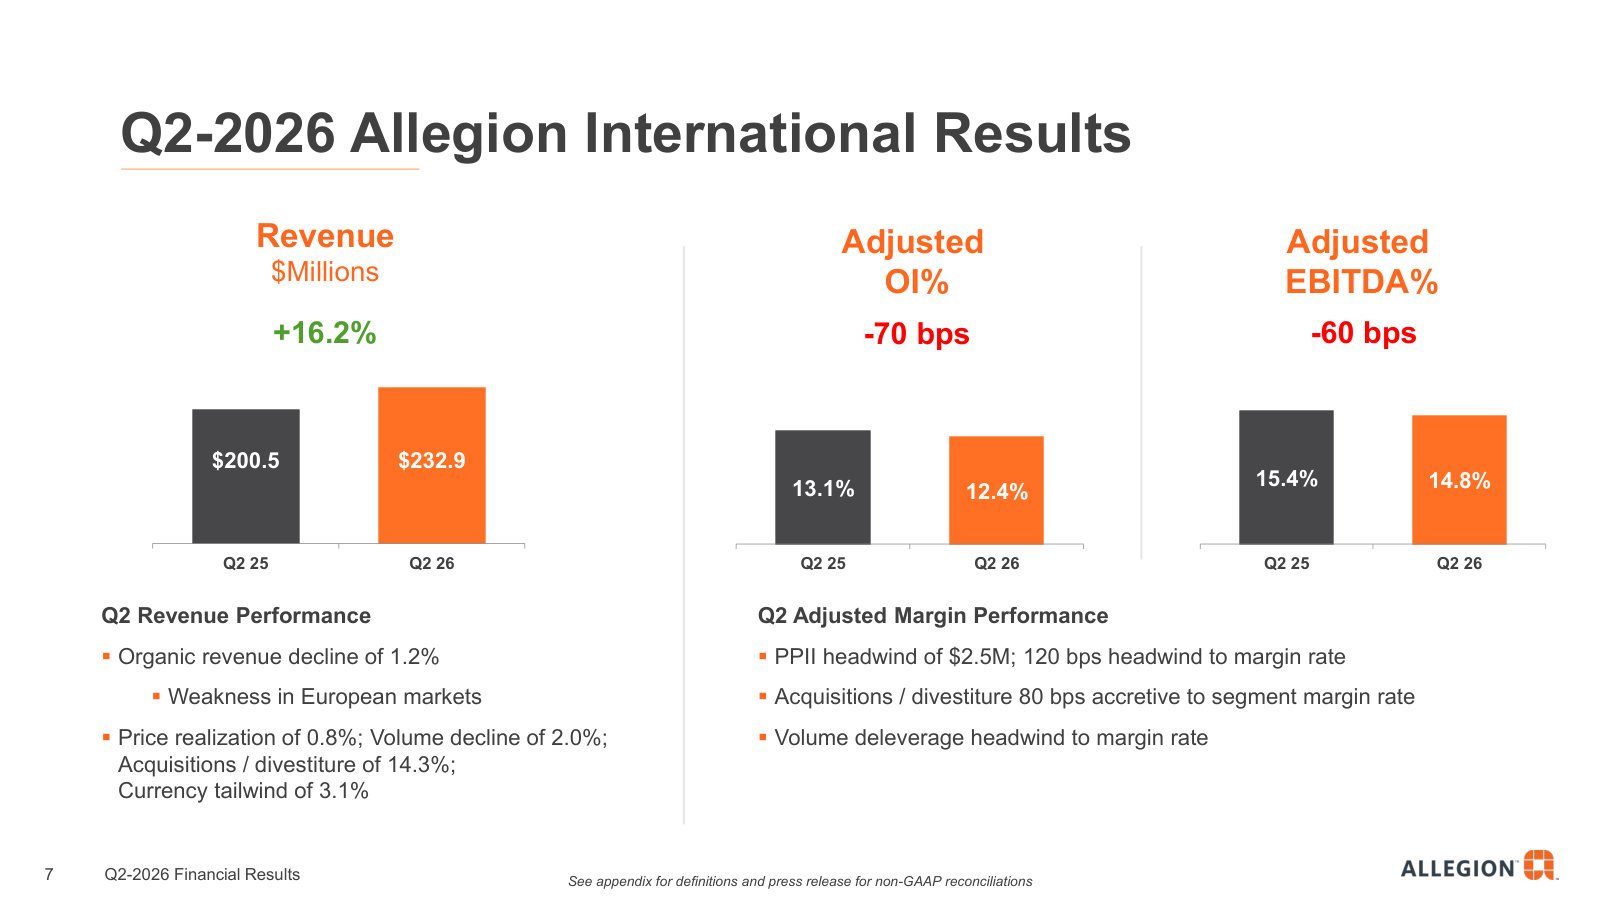
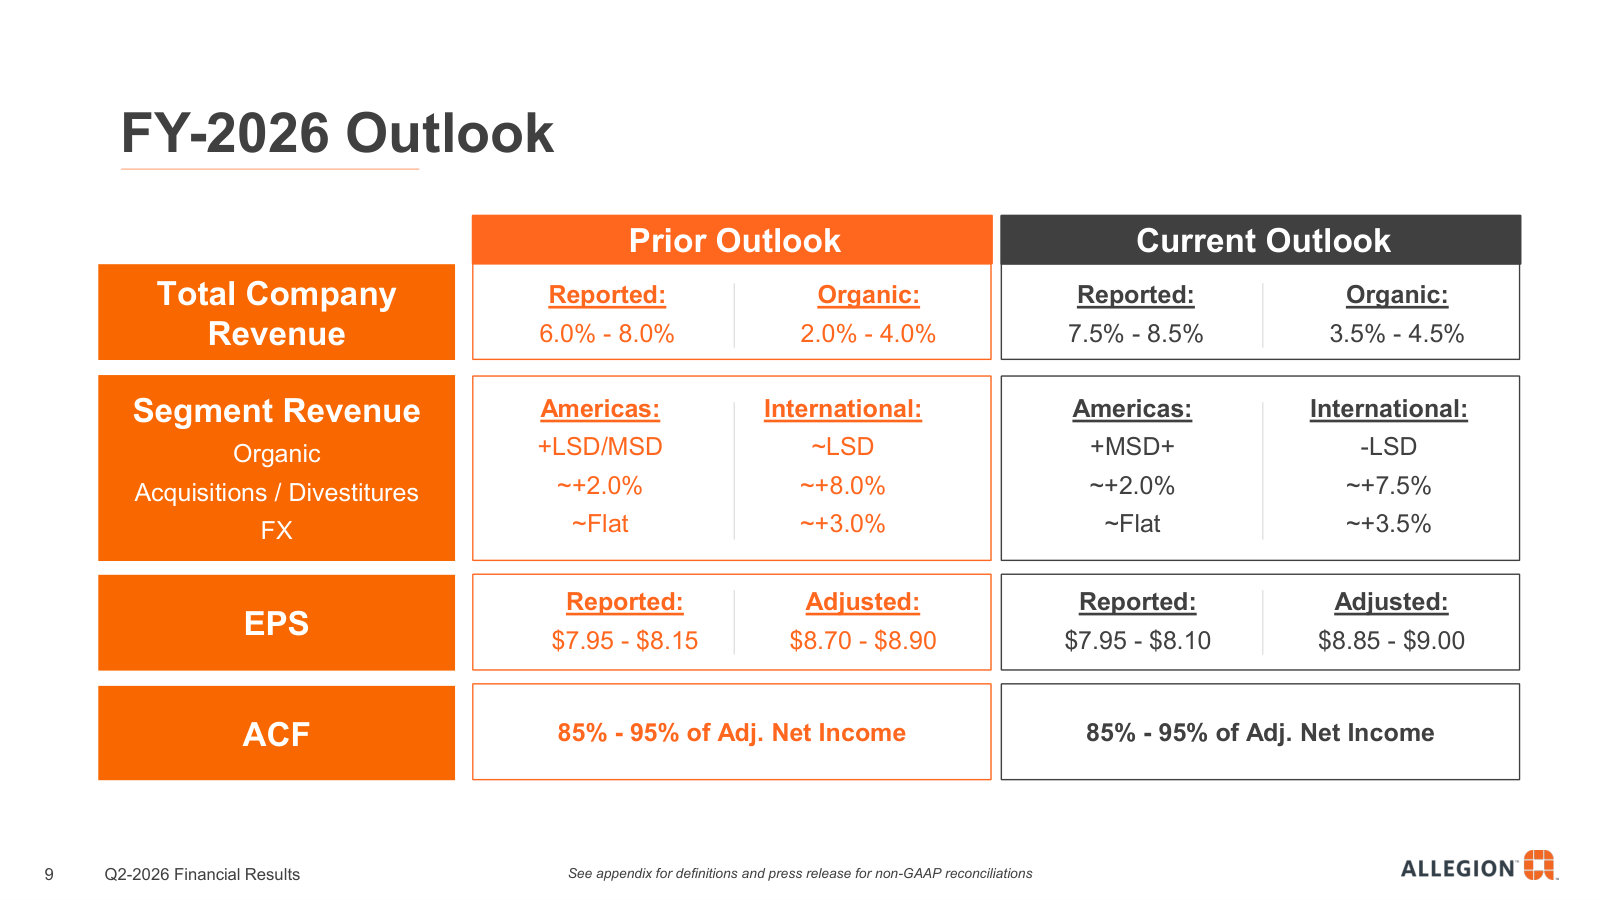
Q2 2026 Earnings Call Presentation — Q2 2026
The latest quarterly deck — current revenue, segment results and full-year guidance, showing how the investor-day model is tracking now. · Open the full document →
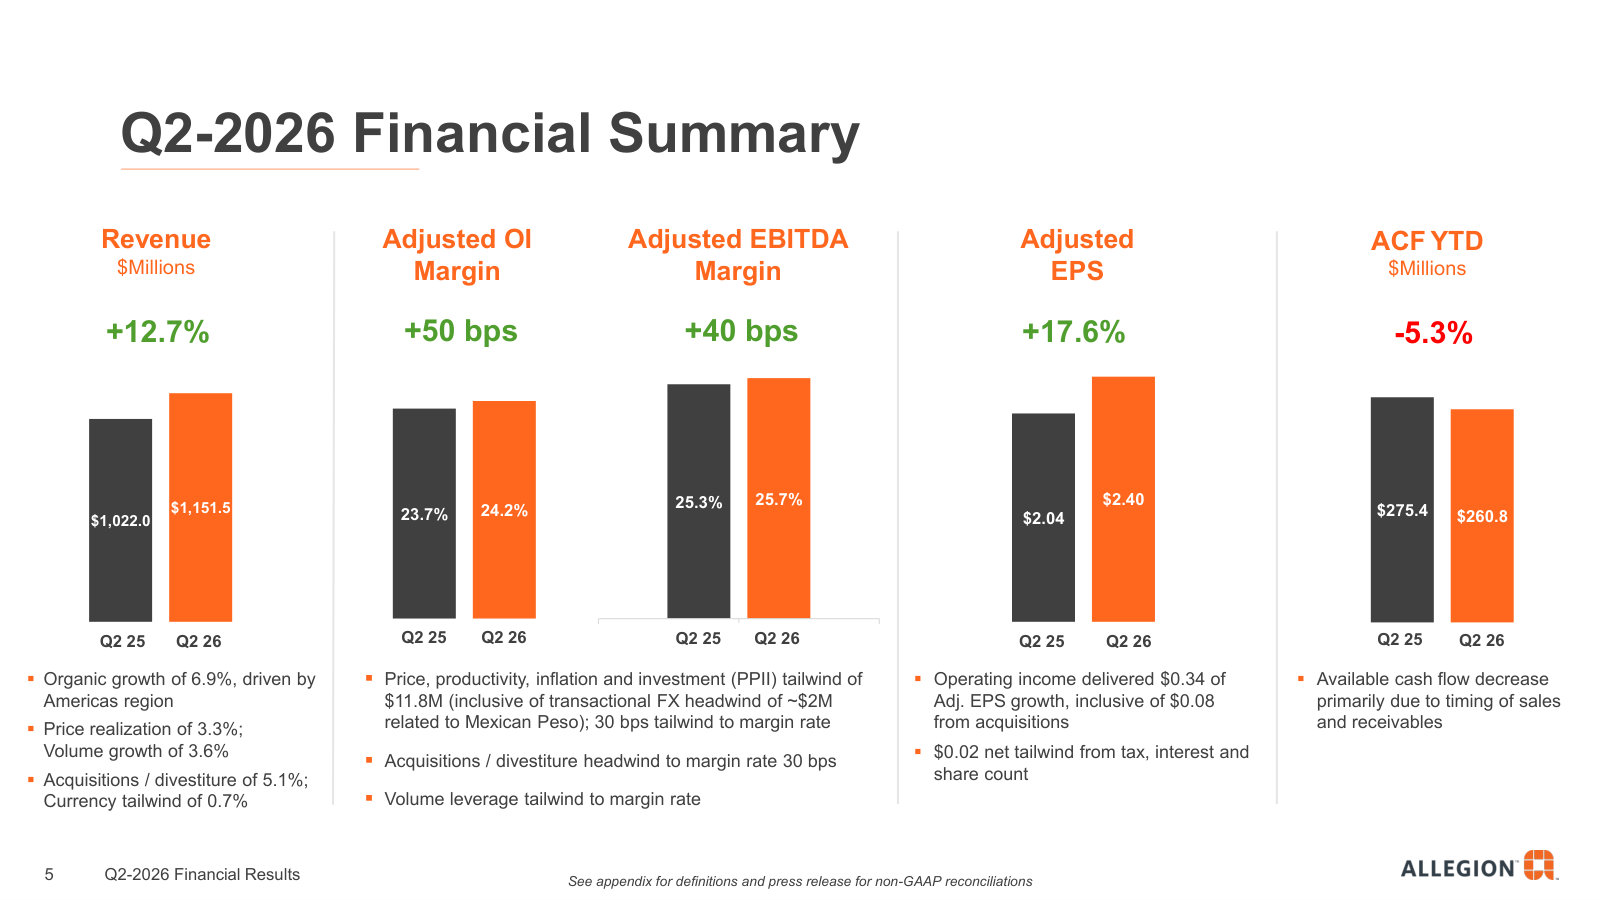
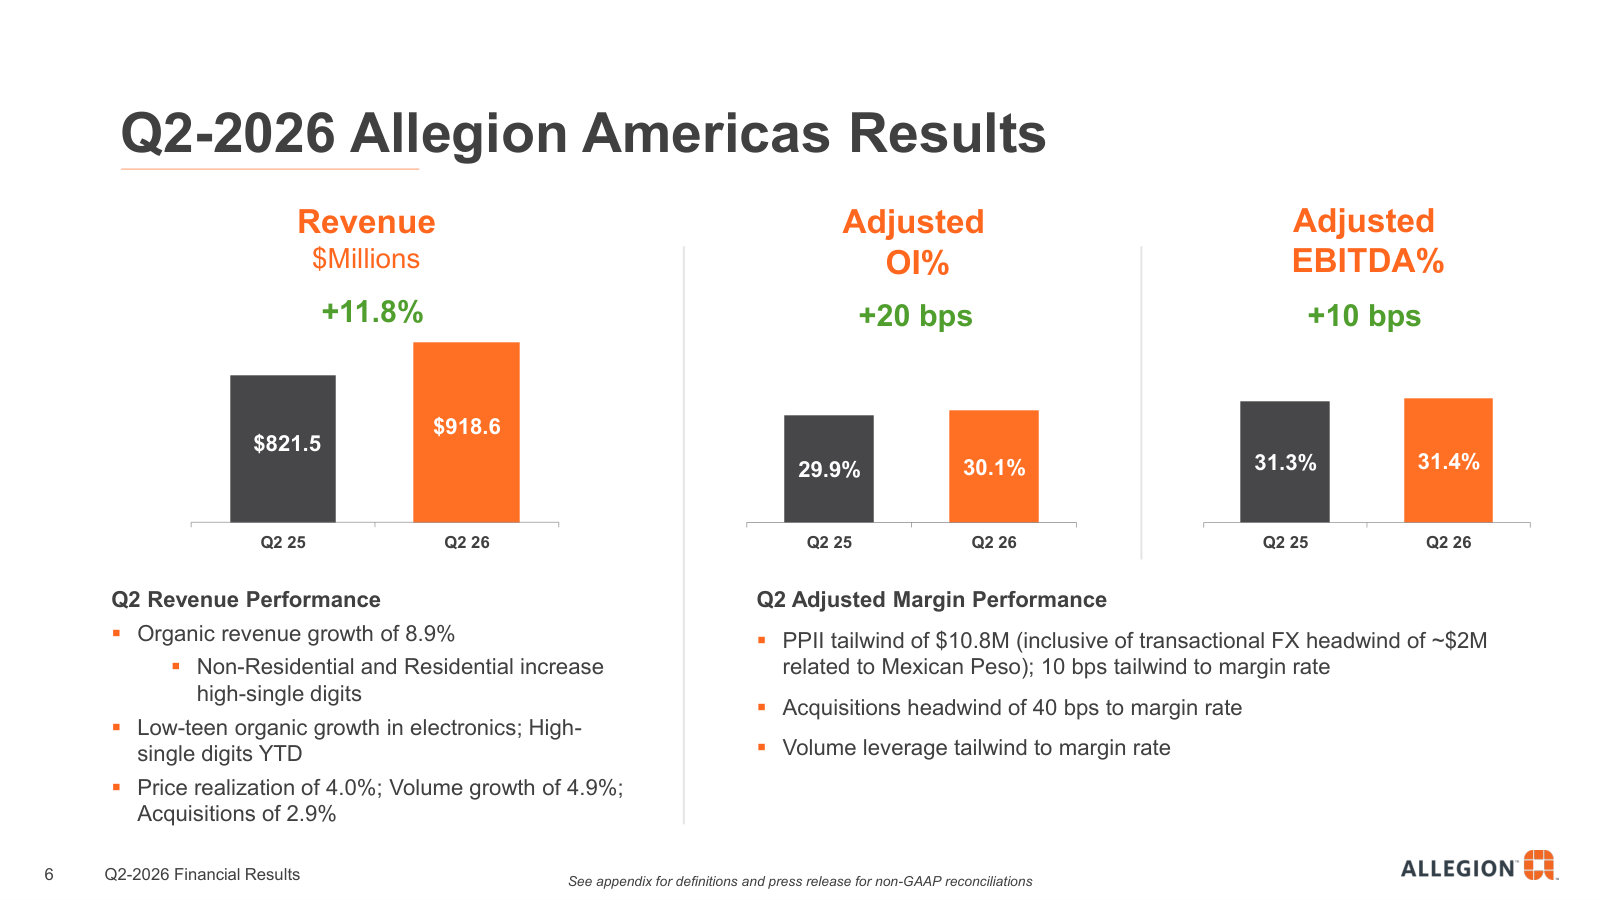
More from management
Q4 / Full-Year 2025 Earnings Call Presentation — Q4 / FY 2025 · 19 pages · Full-year 2025 results and the 2026 end-market outlook by segment — the baseline the current year builds on. · Open →
Allegion plc's management answers for the business every quarter. These are the exchanges that explain it best — verbatim, from the call transcripts preserved in Sources. Each link opens the full transcript at that page in a new tab.
Q2 FY2026 Earnings Call — Q2 FY2026
The freshest read on accelerating non-residential demand, electronics-led growth, and how tariffs pass through to pricing and margins. · Open the full transcript →
Why higher education's shift to mobile credentials pulls through large, multiyear hardware-upgrade cycles for Allegion.
John Stone (President and CEO): Let's take a look at capital allocation, starting with our organic investments and ongoing demand trend for electronics. Higher education offers a clear example of continued secular growth in electronics. As demand for mobile technology increases on college campuses, these customers are moving from plastic cards and mechanical keys to contactless mobile credentials provided and managed by Allegion. This also drives large-scale hardware modernization. In a recent example from our team, 2 flagship university deployments turned into multimillion-dollar opportunities for our company, stemming from thousands of Allegion reader and lock upgrades paired with system-wide Allegion credential standardization.
p. 7 · Read in context →
Tariffs are just another form of inflation, covered by price and productivity to keep margins expanding.
Michael Wagnes (CFO): Yes. I would say, as we think about our business, tariff and inflation, right, tariff is a form of inflation. And what we're going to do is we're going to manage those inputs. We're going to drive pricing and productivity such that we're going to cover the inflation in the investments. What you saw in the second quarter is we're back to expanding margins and covering, obviously, the cost basis. Q1, a little pressure in the Americas, Q2 back to expansionary margins from PPII. I do expect for the full year, we will be neutral to slightly positive on PPII in the Americas. That would be obviously expansionary in the back half.
p. 15 · Read in context →
The non-res mix: a broad-based recovery, plus data centers as a small but fast-growing future aftermarket.
John Stone (President and CEO); Tomohiko Sano (analyst): And non-res is certainly the largest part of Allegion's business, and demand has been improving. The momentum is good. The forward-looking signals around spec activity and the AIA consensus is favorable. […] I would say, consistent with what we said on the spec activity, the project work, our customers' backlogs are very much broad-based. And you do see some cyclical recovery in commercial verticals like multifamily and ofice that have been depressed for the last few years. […] Data centers, obviously, a very rapid growing space. It's small. It's probably approaching 5% of our non-res business at this point and still growing very rapidly. And that's a future installed base that will generate aftermarket sales in the coming years.
p. 17 · Read in context →
Q4 and Full-Year 2025 Earnings Call — Q4 FY2025
The annual call that frames the strategy: a brand-led franchise, spec-driven non-res, disciplined M&A, and the 2026 guidance philosophy. · Open the full transcript →
The 100-year brand franchise, extended down-market with mid-tier lines to win more of the non-res aftermarket.
John H. Stone (Chief Executive Officer): A core element of Allegion’s portfolio strength is our brands’ legacy of innovation. Brands like Schlage, Von Duprin, and LCN invented their product categories a hundred years ago and are known as pioneers in our industry. Allegion is built on that legacy by expanding our offerings of mid-tier commercial product lines. Last September, we launched our Schlage Performance Series locks providing more ways to win in the nonresidential aftermarket alongside the mid-price point Von Duprin 70 Series exit devices released in 2024.
p. 6 · Read in context →
The core thesis: spec-writing, a large installed base and proven pricing power make for a resilient business.
John H. Stone (Chief Executive Officer): before we discuss the 2026 outlook, I want to provide an overview of our key end-market assumptions. In the Americas, we see continued volume growth in nonresidential markets similar to 2025 levels and this is supported by our spec-writing trends.
A broad end-market exposure and large installed base make for a resilient business, one that is less reliant on any single end-market vertical to drive growth. We do expect a more modest price contribution, however, to reflect slightly lower inflation as compared to last year. If inflation were to remain higher, the business has proven our ability to manage inputs and drive the necessary pricing as you saw in 2025.
p. 9 · Read in context →
Why residential softness gets a prudent 2026 assumption — and why thin channel inventory limits the downside.
Joseph John O'Dea (Wells Fargo); John H. Stone (Chief Executive Officer): But just looking at resi, it did end softer than we had contemplated. And I think that is part of the things that just cause us to at least take what we think is a very prudent assumption into 2026 that we would expect resi to be soft, and certainly, should there be an uptick in that market, we are positioned very well to capture upside there.
I would say with your question around pricing, no, there was not any short-term reaction on pricing nor do I think that contributed to any of the demand softness. The last point would be our channel does not hold a lot of inventory, and so any inventory correction-type actions are usually very short lived.
p. 11 · Read in context →
How management screens the M&A pipeline: on-strategy, where it has a right to win, and disciplined on returns.
Robert Schultz (analyst); John H. Stone (Chief Executive Officer): And then just on M&A, how does your pipeline look today, and are you seeing any increasing competition for deals now? […] Pipeline is very active, I would say, in both our International and our Americas segments, and largely in line with the strategic overlay we shared with you at our Investor Day last May in terms of core Mechanical portfolio, Electronics, and even complementary software. So I think pipeline is busy. I think it is a very encouraging outlook.
And with all that being said, you can still count on us to be quite disciplined and making sure we are sticking very close to our strategy, understanding where we have got competitive advantage, right to play and a right to win, and very much focused on our shareholder returns.
p. 15 · Read in context →
The 'tyranny of the math': tariff pricing dilutes margin rate until the comp laps, then core incrementals resume.
Christopher M. Snyder (Morgan Stanley); Michael J. Wagnes (Chief Financial Officer): If you think about the fundamentals of the business, right, that core incrementals we laid out at Investor Day, after we get through Q1, that still holds. Think of that core incrementals being strong once we get through that Q1. So as you think about the full year, margin expansion in the Americas, like I mentioned earlier, just that one more quarter we need to get through. But the business fundamentals remain sound and consistent with what we talked about at Investor Day where we can leverage that volume once we get through this last quarter of the tyranny of the math.
p. 18 · Read in context →
Q4 and Full-Year 2023 Earnings Call — Q4 FY2023
The decade-retrospective call that lays out how Allegion works: electronics secular growth, the ~50/50 aftermarket base, the margin algorithm, and late-cycle dynamics. · Open the full transcript →
A record decade capped by ~20% electronics growth — the proof point for the seamless-access thesis.
John Stone (President and CEO): After celebrating our 10th anniversary as a standalone company in December, we closed the year with record revenue, adjusted operating income, and adjusted EPS. Reinforcing the thesis behind our seamless access strategy, electronics demand remained strong. We delivered approximately 20% organic growth in electronics for the year as supply chains normalized, and that’s on top of mid-teens organic growth in the prior year.
p. 2 · Read in context →
The capital-allocation framework: an even split of M&A and shareholder returns; bolt-ons routine, big deals episodic.
John Stone (President and CEO): Reflecting on Allegion’s first 10 years, we’ve had a roughly even split between inorganic growth and the return of capital to shareholders through dividends and share repurchases. We remain committed to balanced, consistent capital allocation, and having quickly delevered from the Access Technologies acquisition, our balance sheet supports this strategy. […] Bolt-on acquisitions that fill portfolio gaps in the hardware space and high margin, recurring revenue business in the access solutions space will remain priorities. Larger deals like Access Technologies may be more episodic, but we will be disciplined and have demonstrated the ability to quickly delever.
p. 3 · Read in context →
The margin algorithm — roughly 60 bps a year from net price and productivity — and why late-cycle visibility underpins growth.
John Stone (President and CEO): Since the beginning of 2019, we’ve averaged approximately 60 basis points of margin contribution annually from net price and productivity. This has been a hallmark of the business over time and it’s a key driver of our 2024 outlook. […] As you all know, Allegion is a late-cycle business, and starts can lead our business by a year or more. We’re not expecting many market tailwinds, however, we believe the visibility and stability of late-cycle institutional verticals, as well as our large installed base, will allow us to deliver organic growth.
p. 7 · Read in context →
The demand structure: about 50/50 new construction versus aftermarket, with the stable aftermarket underpinning the portfolio.
Joe O'Dea (Wells Fargo); John Stone (President and CEO): if you think of Allegion has about 50-50 new construction to aftermarket exposure. The aftermarket is quite stable across all verticals, break fix, repair and maintenance, even some tenant turnover here in commercial office. So the aftermarket is still, I think, pretty stable and underpins the overall portfolio, that’s what leads us to come up to low to mid-single digits for growth in non-res.
p. 10 · Read in context →
The hard question — is non-res weakness just channel destock or the cycle turning? Management calls the destock temporary.
Chris Snyder (UBS); John Stone (President and CEO): So when — and I know, I guess, Americas non-res has stated organic positive, but the growth has decelerated a lot here over the last two to three quarters. But starts only really came down maybe two quarters ago. So when we see that deceleration or softening in the non-res Americas growth rate, is it fair to assume that that’s really just been the channel destock and any sort of cycle pressure that could come from those starts is still on the horizon? […] the channel destock that was, in our opinion, a rather unique and temporary phenomenon that just happened because of all the supply chain disruptions and the lead times got extended and backlogs got extended and ordering patterns were disrupted. I think you saw that manifest itself in late 2022 through about mid ’23. We feel like most of that is in the rearview for the industry.
p. 18 · Read in context →
More calls
Q1 FY2026 Earnings Call — Q1 FY2026 · 25 pages · Where 2026's tariff-driven Americas margin pressure first appears, alongside the strong non-res specification commentary. · Open →
Q3 FY2025 Earnings Call — Q3 FY2025 · 20 pages · The residential electronics product launch of this quarter that management later cites as its tough 2026 comparison. · Open →
Q2 FY2025 Earnings Call — Q2 FY2025 · 25 pages · A mid-2025 read on non-res momentum and electronics ahead of the demand acceleration. · Open →
Q1 FY2025 Earnings Call — Q1 FY2025 · 24 pages · The start-of-2025 outlook and early demand signals across the Americas and International segments. · Open →
Q4 and Full-Year 2024 Earnings Call — Q4 FY2024 · 24 pages · The prior full-year call: 2024 results, the initial 2025 outlook, and the margin framework carried into 2025. · Open →
Q3 FY2024 Earnings Call — Q3 FY2024 · 20 pages · Non-res spec activity and electronics progress heading into 2025. · Open →
Q2 FY2023 Earnings Call — Q2 FY2023 · 27 pages · The residential downturn and channel destock as they were unfolding through 2023. · Open →
Q4 and Full-Year 2022 Earnings Call — Q4 FY2022 · 23 pages · John Stone's first full-year call as CEO, with the Access Technologies acquisition freshly closed and integrating. · Open →
Allegion plc's annual reports contain management's most considered account of the business. These are the sections, passages and visual pages worth opening in the originals preserved in Sources.
Allegion plc — FY2025 Annual Report (Form 10-K) — FY2025
The latest 10-K: the security-hardware business, its 40+ brands, what drove 2025 results, and the two-segment split. · Open the full document →
Item 1. Business — p. 6 · Read the full section →
How Allegion makes money — door hardware and access control sold through distribution under 40+ brands like Schlage and Von Duprin.
Management's own description of the business and its market-leading brand portfolio.
Allegion plc ("Allegion," "we," "us" or "the Company") is a leading global provider of security products and solutions that keep people and assets safe and secure in the places they live, learn, work and connect. […] We offer an extensive and versatile portfolio of security and access control products and solutions across a range of market-leading brands. Our experts around the world deliver high-quality hardware, software, services and systems, and we use our deep expertise to serve as trusted partners to end-users who seek customized solutions to their security needs
p. 6 · Read in context →
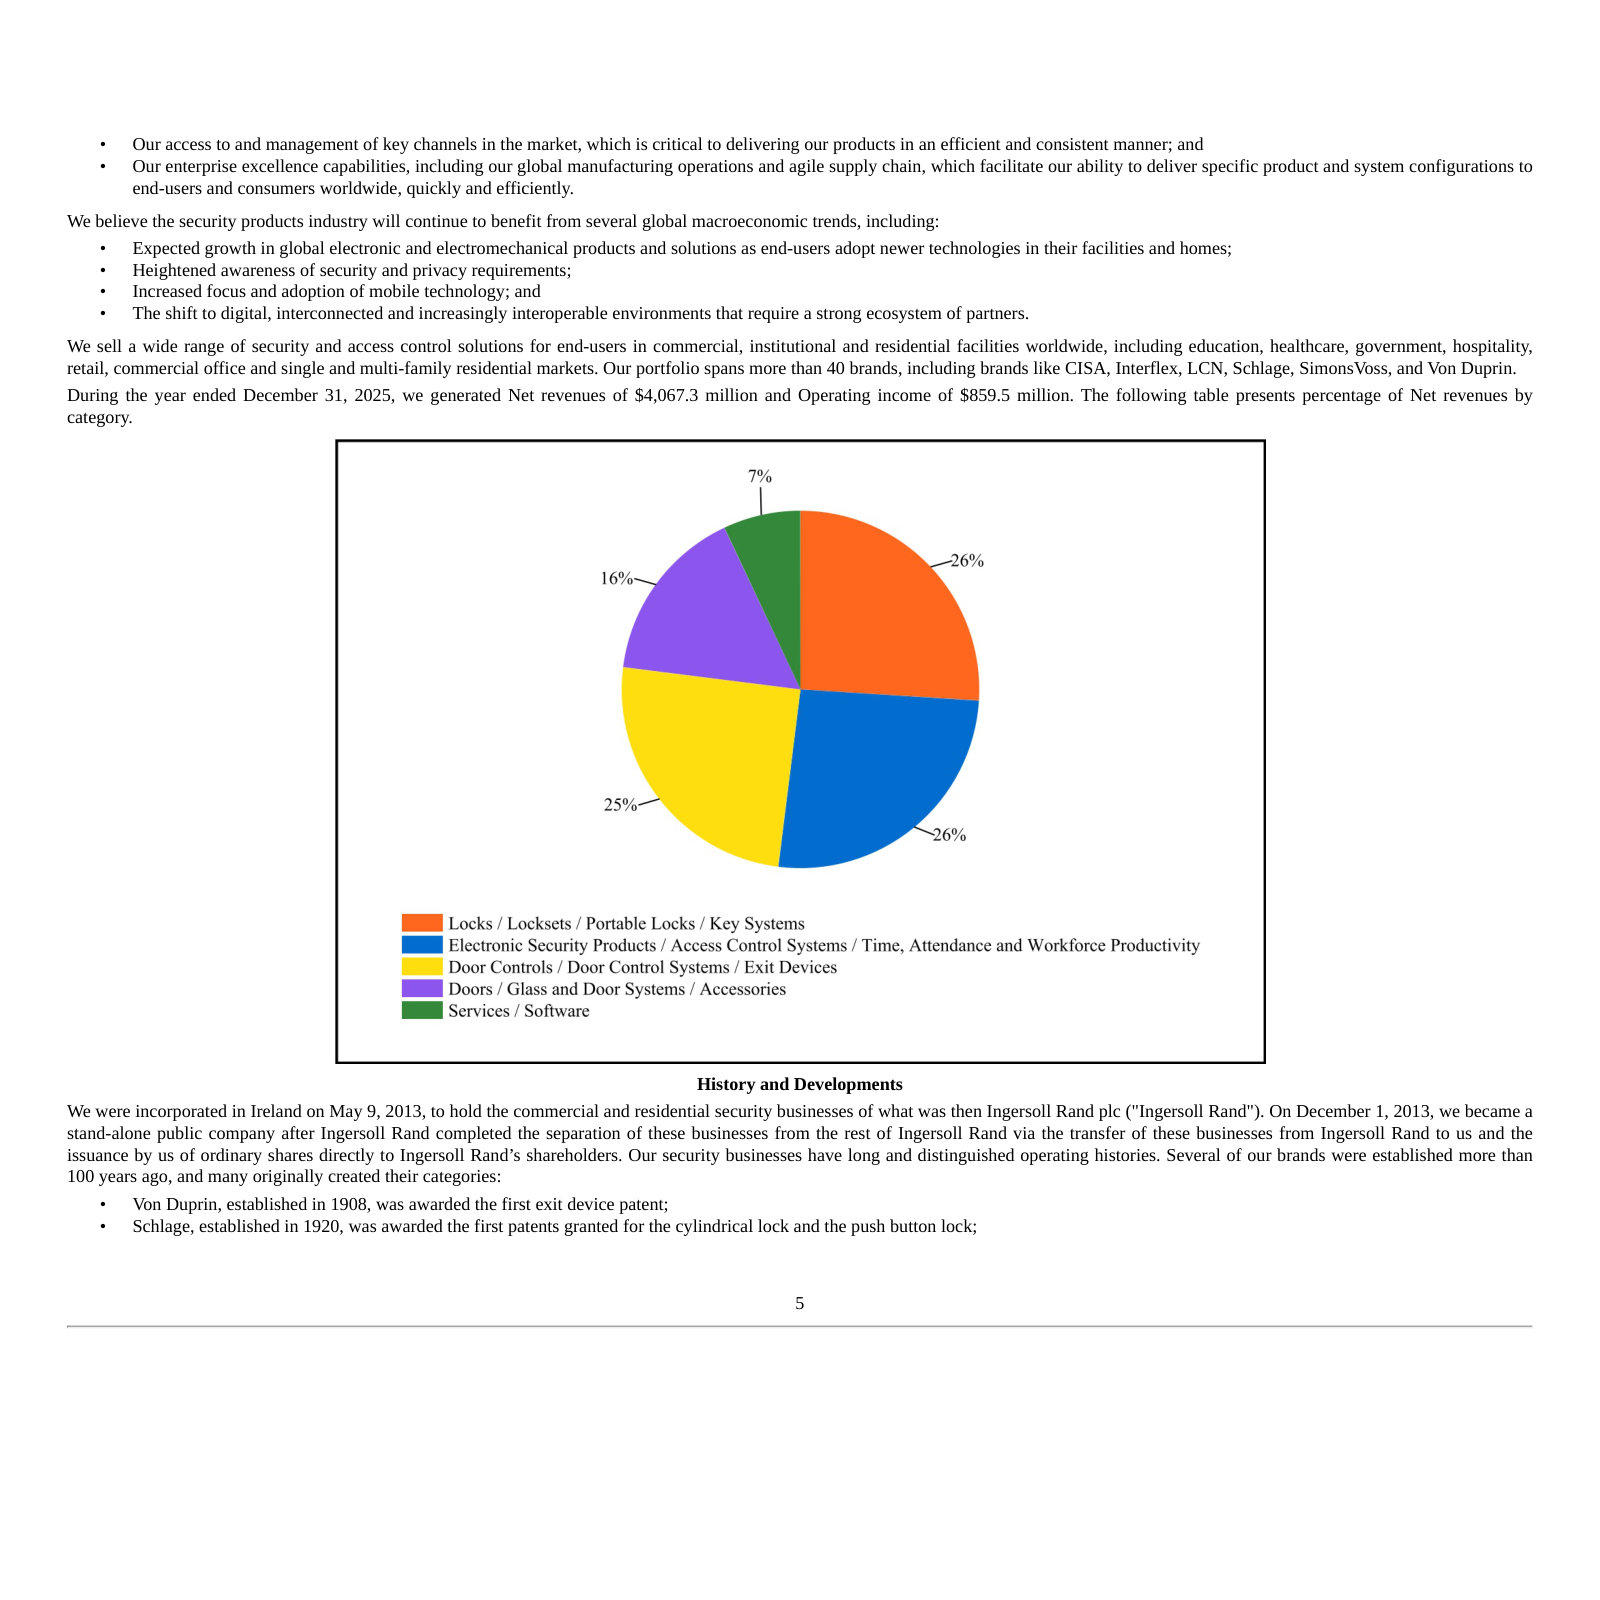
Item 1A. Risk Factors — p. 14 · Read the full section →
The two risks most specific to this business: construction-cycle demand and tariff exposure on Mexico-heavy sourcing.
Demand rides the institutional, commercial and residential construction and remodeling cycle.
Our business performance is impacted by the strength of the institutional, commercial and residential construction and remodeling markets and global macroeconomic factors. […] Demand for our security products and solutions relies on the institutional, commercial, and residential construction and remodeling markets, which are marked by cyclicality based on national, regional and local economic conditions, including consumer confidence and disposable income, corporate and government spending, work-from-home trends, availability of credit and demand for new housing and infrastructure.
p. 14 · Read in context →
Tariffs and global-trade risk: ~20-25% of COGS is sourced from Mexico, offset in 2025 with pricing.
Our global operations subject us to political, economic and regulatory risks, including uncertainty related to the imposition of new or increased tariffs and the global trade environment more generally. […] Throughout 2025, the U.S. government announced tariffs on imports from several countries from which we manufacture and/or import products and components. In 2025, we have offset inflation due to tariffs with pricing actions. We estimate we source approximately 20-25% of Cost of goods sold from Mexico and less than 5% of Cost of goods sold from China.
p. 15 · Read in context →
Item 7. Management's Discussion and Analysis — p. 30 · Read the full section →
Where management explains 2025: high-single-digit revenue growth from pricing, volume and acquisitions, plus the tariff response.
2025 trends and outlook — growth drivers, the electronics tailwind, and where COGS is sourced.
In 2025, we delivered high-single digit revenue growth compared to 2024, driven by favorable pricing and volume growth, as well as the impact from acquisitions made during the year. Demand for electronic security products has also remained strong and continues to be a long-term growth driver. […] We estimate we source approximately 20-25% of cost of goods sold ("COGS") from Mexico, less than 5% of COGS from China, and 5-10% of COGS from all other non-US countries.
p. 30 · Read in context →
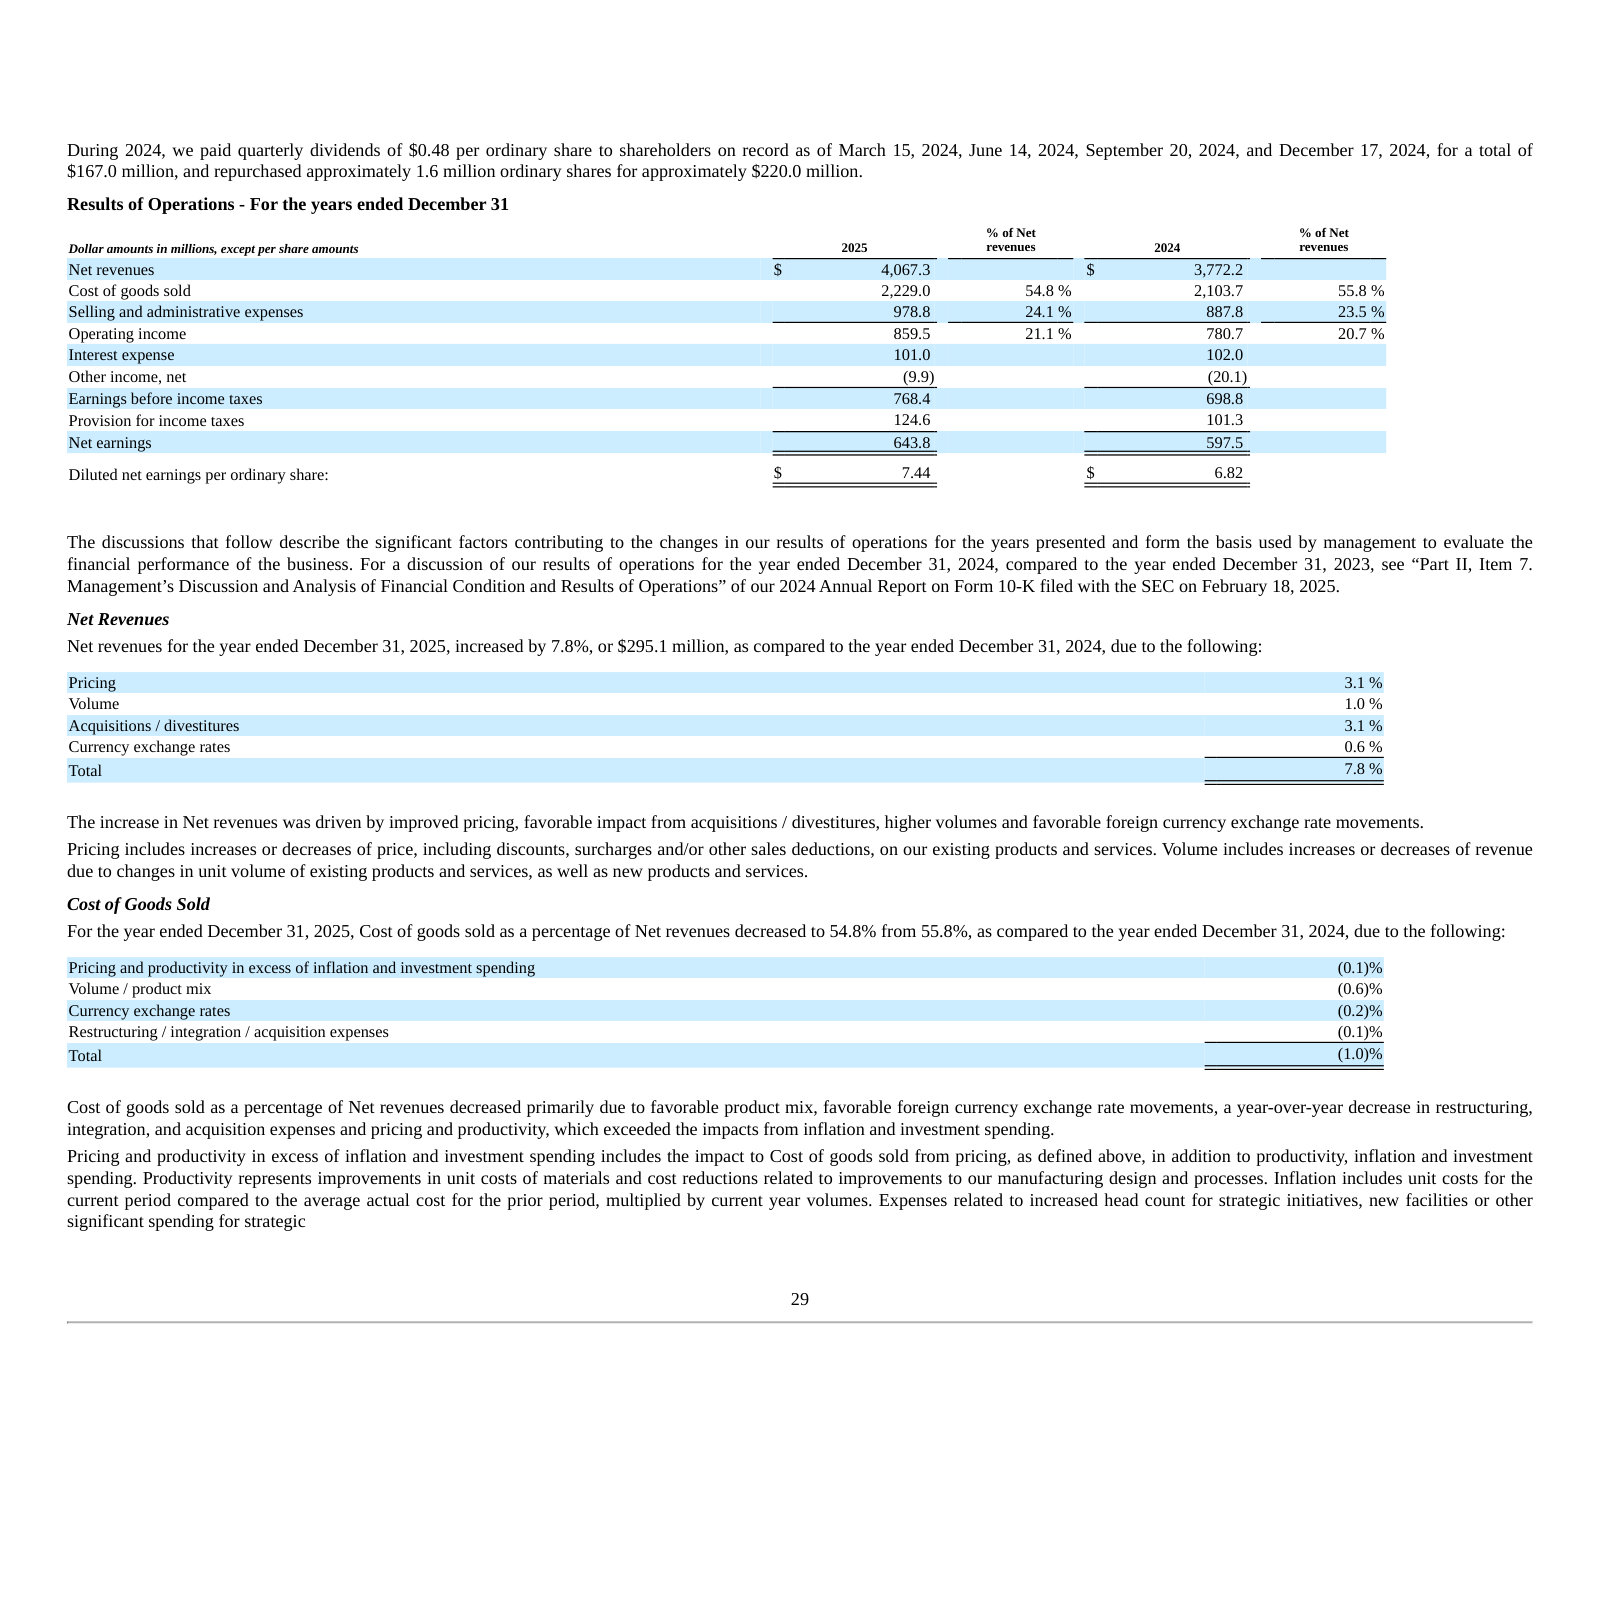
Review of Business Segments — p. 33 · Read the full section →
The two-segment split: Allegion Americas is the ~28%-margin profit engine; International is smaller, lower-margin and scaling via M&A.
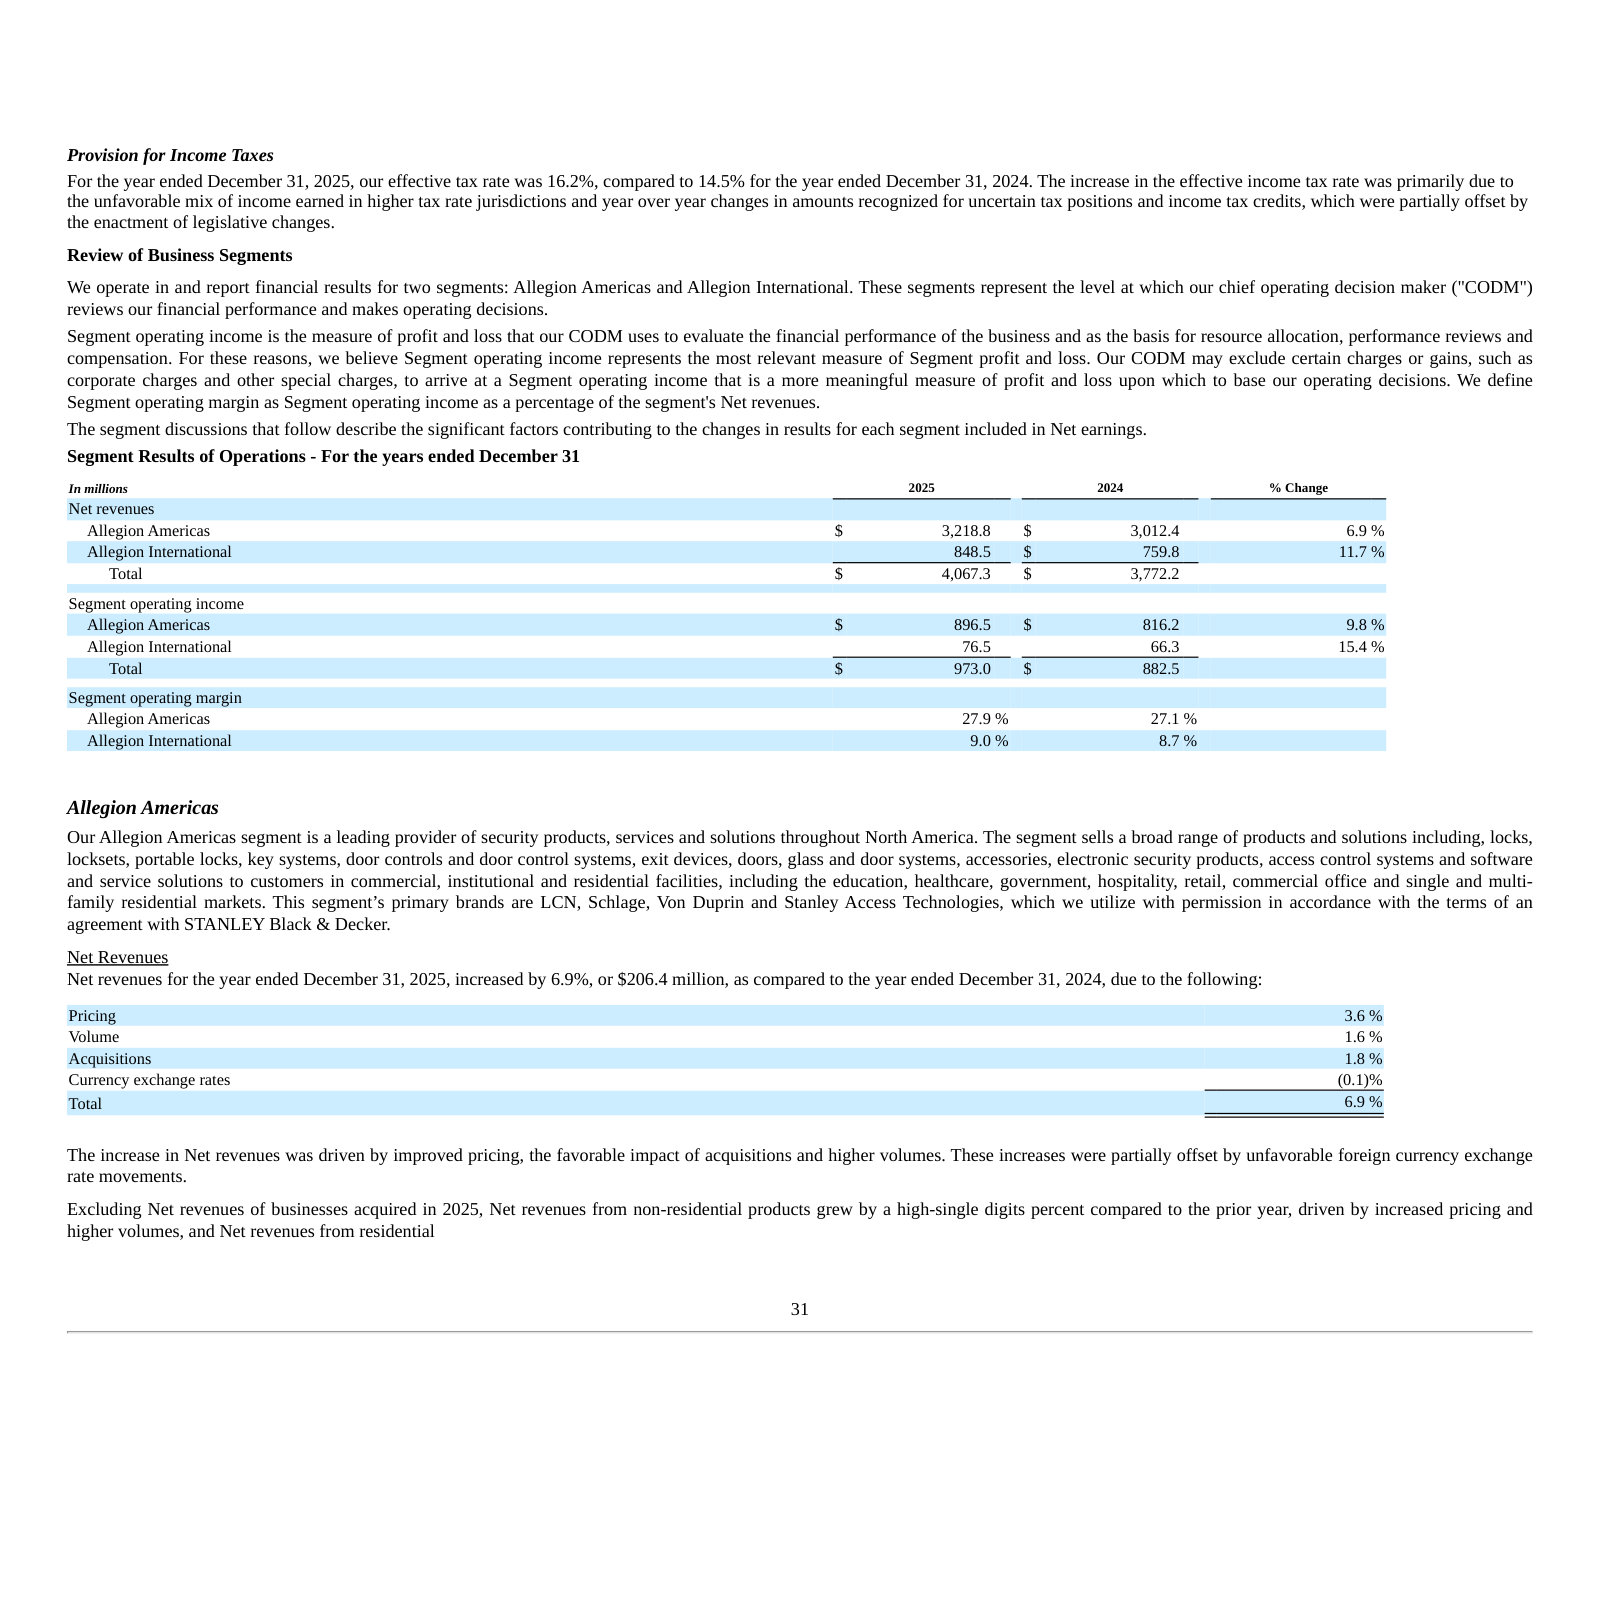
Allegion plc — FY2021 Annual Report (Form 10-K) — FY2021
Included for one evolution: the 2021 redefinition that created today's two reportable segments. · Open the full document →
Review of Business Segments — p. 38 · Read the full section →
Documents the move from three segments (Americas, EMEA, Asia Pacific) to today's Allegion Americas and Allegion International.
The January 2021 segment redefinition that combined EMEA and Asia Pacific into Allegion International.
As previously announced, effective January 1, 2021, we combined our previous operations in EMEA and Asia Pacific into a new segment named Allegion International, in addition to renaming our Americas segment "Allegion Americas".
p. 38 · Read in context →
More annual reports
Allegion plc — FY2024 Annual Report (Form 10-K) — FY2024 · 90 pages · Prior-year 10-K; baseline for the 2025 revenue and margin comparisons. · Open →
Allegion plc — FY2023 Annual Report (Form 10-K) — FY2023 · 89 pages · Two-segment reporting; useful for a longer margin and acquisition trend line. · Open →
Allegion plc — FY2022 Annual Report (Form 10-K) — FY2022 · 90 pages · First full year on the two-segment basis after the 2021 redefinition. · Open →
Competitors describe Allegion plc's market in their own filings and calls. These verified passages and visual pages show where their strategies meet, using source documents preserved in Sources.
dormakaba (DOKA)
Allegion's closest listed pure-play analog: a global access-and-door-solutions maker whose door closers, exit devices, mechanical key systems and electronic access lines compete head-to-head with Schlage, Von Duprin and LCN across the same commercial markets.
Dormakaba's characterization of the security-and-access-solutions market it shares with Allegion — still highly fragmented, with the top three suppliers holding only about one third of it, and consolidation continuing.
Opportunities arise from the ongoing and anticipated consolidation of the industry in which dormakaba operates. Despite past consolidation, the market for security and access solutions remains highly fragmented, with the top-three companies holding only about one third of market share. dormakaba plans to further strengthen its market position and will therefore continue to play an active role in industry consolidation.
p. 33 · Read in context →
Dormakaba's own map of its core businesses — door closers, exit devices and mechanical key systems among them — the exact categories that overlap Allegion's LCN closers, Von Duprin exit devices and Schlage key systems.
dormakaba Group (dormakaba) is a leading provider in the access solutions market. The company offers customers a broad, innovative portfolio of products, solutions, and services that easily fit into building ecosystems. With a clear portfolio segmentation, dormakaba concentrates on its global core businesses Access Automation Solutions (door operators, sliding doors, and revolving doors), Access Control Solutions (connected devices and engineered solutions), Access Hardware Solutions (door closers, exit devices, and mechanical key systems), and Services.
p. 28 · Read in context →
Dormakaba's stated plan to expand in North America — Allegion's largest and most profitable market — across door hardware, entrance automation and commercial access control, targeting GDP+2% annual growth.
In North America, we are strengthening our position with a Growth Plan that focuses on selected geographies and distribution accounts in our Access Hardware Solutions, while improving commercial productivity and enhancing our product offerings. […] In Access Control Solutions, we are building on our strength in hospitality, further developing the multi-housing business and strengthening and bundling our offering for the commercial access control segment. This plan targets GDP+2% annual growth.
p. 14 · Read in context →
Fortune Brands Innovations (FBIN)
Its Security segment (Master Lock, Yale, August, SentrySafe) competes directly with Allegion in residential and multifamily locks, smart/connected locks and electronic access control — and its 10-K names Allegion's flagship Schlage brand as a competitor.
Fortune Brands' 10-K lists Schlage — Allegion's flagship residential lock brand — among the competitors its Master Lock, Yale and August lock lines face.
Master Lock, American Lock, Yale and August competes with Abus, W.H. Brady, Hampton, Kwikset, Schlage and various imports, and SentrySafe competes with First Alert, Magnum, Fortress, Stack-On and Fire King.
p. 6 · Read in context →
Fortune Brands' account of its connected-lock installed base and its Yale/Matter smart-lock launch with Google — the connected-lock arena where it competes with Allegion's Schlage electronic locks.
Nicholas Ian Fink, CEO: Turning to our digital business. We now have around 5 million active users. We continue to see solid momentum. And in the second quarter of 2025, we had around 220,000 digital device activations. […] We also successfully launched our new Yale Smart Lock with Matter designed for Google Home. This is a significant milestone in our long-standing partnership with Google and the evolution of the original Nest by Yale lock.
p. 2 · Read in context →
Fortune Brands describing its Yale Pro 2 launch into multifamily smart access — the electronic access-control category for multifamily and institutional buildings that Allegion also targets.
David Barry, Interim Chief Executive Officer: In Security, we launched the Yale Pro 2 product line in February, adding a suite of products engineered for multifamily facilities, providing a fully integrated smart access experience. Backed by the shortest lead time in the industry, Pro 2 ensures faster deployment so property managers can upgrade access control solutions without delay.
p. 3 · Read in context →
Honeywell (HON)
Through its 2024 acquisition of Carrier's Global Access Solutions, Honeywell's Building Automation segment now sells electronic locking, access control and mobile credentials — a direct and growing collision with Allegion's core commercial access franchise, backed by a large installed base it can cross-sell into.
Honeywell's disclosure of its $4.9bn purchase of Carrier's Global Access Solutions — electronic locking systems and contactless mobile keys that place it directly against Allegion's access-control and electronic-lock products.
On June 3, 2024, the Company acquired 100% of the outstanding equity interests of Carrier Global Corporation's Global Access Solutions business (Access Solutions), an innovative global leader in advanced access and security solutions, electronic locking systems, and contactless mobile key solutions, for total consideration of $4,913 million, net of cash acquired. The business is part of the Building Automation reportable business segment.
p. 95 · Read in context →
Honeywell quantifies the Access Solutions contribution to its Building Automation segment — the scale of its access-control push, in a segment running at a 26.5% margin.
Sales increased $827 million due to higher organic sales of $287 million in Products and higher organic sales of $217 million in Building Solutions, both driven by higher demand. Additionally, the acquisition of Access Solutions contributed $302 million of inorganic sales growth during 2025. Beginning June 2025, the results of Access Solutions are considered organic. Segment profit increased $272 million and segment margin increased 80 basis points to 26.5% compared to 25.7% for the same period of 2024.
p. 38 · Read in context →
Honeywell's CEO on the acquired access-control business, which he says is growing high-single-digits in line with Building Automation and validating the acquisition thesis.
Vimal Kapur, Chairman and CEO: So, Andrew, the Access Solution acquisition is playing well, and overall, the revenue in that segment is growing high single digits. In line with building automation, which is growing high single digits. So our thesis has played out quite well.
p. 16 · Read in context →
Stanley Black & Decker (SWK)
A former competitor that exited Allegion's categories: it sold its commercial electronic-security business to Securitas and its automatic-doors (Mechanical Access Solutions) business to Allegion in 2022. Its filing records that transaction — a direct mention of the subject and a marker of Allegion's move into entrance systems.
Stanley Black & Decker's record of selling its automatic-doors (Mechanical Access Solutions) business to Allegion in 2022 — Allegion's entry into entrance systems and Stanley's exit from the category.
On July 5, 2022, the Company completed the sale of its Mechanical Access Solutions ("MAS") business comprised of the automatic doors business to Allegion plc for net proceeds of $916.0 million and recorded a pre-tax gain of $609 million.
p. 179 · Read in context →
More peer documents
dormakaba Annual Report FY2023/24 — market and strategy — 166 pages · Prior-year report; repeats the 'top three companies account for only about one third of market share' fragmentation view (p31), confirming it as a consistent management framing of the shared access-solutions market. · Open →
Fortune Brands FY2025 10-K — Security segment — 119 pages · The FY2025 10-K carries the same Security-segment competitor list naming Schlage and Kwikset (p6), plus fuller detail on the Master Lock, Yale, August and SentrySafe lineup that competes with Allegion. · Open →
Fortune Brands Q4 FY2025 earnings call — 13 pages · Management sizes the connected business at under 10% of the portfolio and describes pushing Yale locks into single-family new construction — the residential builder channel central to Allegion's Schlage business. · Open →
Fortune Brands Q3 FY2025 earnings call — 12 pages · CEO frames a residential-and-commercial digital-security pipeline and cites awards for the Yale Assure Lock 2 — direct color on the connected-lock competition with Allegion. · Open →
Honeywell FY2024 10-K — capital deployment — 158 pages · Details the $9bn, four-acquisition capital deployment that included Carrier's Global Access Solutions (p6), showing the scale of Honeywell's commitment to the access-control market. · Open →
Honeywell Q2 FY2025 earnings call — 13 pages · CFO ties Building Automation's 8% organic growth and margin gain to the Access Solutions acquisition — evidence the access-control asset is accretive and gaining momentum against pure-plays like Allegion. · Open →
Spectrum Brands FY2025 10-K — HHI divestiture — 125 pages · Documents Spectrum's exit from the Hardware & Home Improvement (Kwikset/Baldwin) lock business, sold to Allegion's larger rival Assa Abloy for $4.3bn (p85) — why Spectrum no longer competes, and how the residential-lock market consolidated around Allegion's chief rival. · Open →
Stanley Black & Decker FY2025/26 10-K — portfolio reshaping — 182 pages · Latest 10-K confirms the portfolio reshaping out of security and automatic doors, leaving only Tools & Outdoor and Industrial — context for Stanley's exit from Allegion's categories. · Open →
Source: S&P Capital IQ consensus via Xpressfeed · Generated 2026-07-27.
Estimate momentum
Currency: USD · Scale: money in millions, absolute · Point-in-time consensus; Δ90d is Now versus 90d.
| Metric | FY | 180d | 90d | 30d | Now | Δ90d |
|---|---|---|---|---|---|---|
| EPS (normalized) | FY2027 | $9.58 | $9.53 | $9.57 | $9.72 | +2.0% |
| EPS (normalized) | FY2028 | $11.15 | $10.33 | $10.53 | $10.68 | +3.4% |
| Revenue | FY2027 | $4.54bn | $4.52bn | $4.60bn | $4.63bn | +2.4% |
| Revenue | FY2028 | $5.14bn | $4.72bn | $4.82bn | $4.86bn | +3.1% |
Beat / miss record
Current sequences by metric: Revenue: 2 consecutive beats; EPS (normalized): 1 consecutive beat.
Currency: USD · Scale: money in millions, absolute · Consensus is captured before each actual first became effective.
| Quarter | Metric | Consensus | Actual | Surprise | Outcome |
|---|---|---|---|---|---|
| Q2 FY2026 | Revenue | $1.12bn | $1.15bn | +2.8% | Beat |
| Q2 FY2026 | EPS (normalized) | $2.22 | $2.40 | +8.3% | Beat |
| Q1 FY2026 | Revenue | $1.03bn | $1.03bn | +0.7% | Beat |
| Q1 FY2026 | EPS (normalized) | $1.90 | $1.80 | -5.1% | Miss |
| Q4 FY2025 | Revenue | $1.04bn | $1.03bn | -0.4% | Miss |
| Q4 FY2025 | EPS (normalized) | $1.98 | $1.94 | -2.0% | Miss |
| Q3 FY2025 | Revenue | $1.05bn | $1.07bn | +1.9% | Beat |
| Q3 FY2025 | EPS (normalized) | $2.24 | $2.30 | +2.5% | Beat |
| Q2 FY2025 | Revenue | $999.37m | $1.02bn | +2.3% | Beat |
| Q2 FY2025 | EPS (normalized) | $1.99 | $2.04 | +2.7% | Beat |
| Q1 FY2025 | Revenue | $920.82m | $941.90m | +2.3% | Beat |
| Q1 FY2025 | EPS (normalized) | $1.67 | $1.86 | +11.2% | Beat |
| Q4 FY2024 | Revenue | $938.91m | $945.60m | +0.7% | Beat |
| Q4 FY2024 | EPS (normalized) | $1.75 | $1.86 | +6.3% | Beat |
| Q3 FY2024 | Revenue | $970.04m | $967.10m | -0.3% | Miss |
| Q3 FY2024 | EPS (normalized) | $1.98 | $2.16 | +9.0% | Beat |
Normalized EPS compounds ~9-10% a year, ahead of ~5% revenue growth
Currency: USD · Scale: money in millions, absolute · YoY uses the prior fiscal year from the feed; analyst count and range use the first displayed period.
| Metric | FY2026E | FY2027E | FY2028E | YoY | Analysts | Low / high |
|---|---|---|---|---|---|---|
| Revenue | $4.41bn | $4.63bn | $4.86bn | +8.5% | 11 | $4.39bn / $4.46bn |
| EPS (normalized) | $8.94 | $9.72 | $10.68 | +9.8% | 10 | $8.85 / $9.02 |
| EBITDA | $1.10bn | $1.17bn | $1.26bn | +9.3% | 9 | $1.09bn / $1.12bn |
Analysts split ~11% on FY27 EPS; the gap widens into thin FY28
FY2027 normalized EPS runs from $9.29 to $10.35 across 11 analysts; by FY2028 the range is wider ($9.90-$11.40) on just five, so the outer-year spread reflects thinner coverage as much as real debate.
Currency: USD · Scale: money in millions, absolute · Spread/mean is absolute high-low divided by absolute mean.
| Metric | Period | Mean | Low–high | Spread/mean | Analysts |
|---|---|---|---|---|---|
| EPS (normalized) | FY2027E | $9.72 | $9.29–$10.35 | 10.9% | 11 |
| Revenue | FY2027E | $4.63bn | $4.52bn–$4.72bn | 4.3% | 11 |
| EPS (normalized) | FY2028E | $10.68 | $9.90–$11.40 | 14.1% | 5 |
Coverage thins fast past FY2027 - FY2029 rests on a single analyst
FY2028 lines draw only 2-5 analysts and every FY2029 metric shown carries n=1, so those figures are directional placeholders, not firm consensus. Weight the FY2026-2027 tape, where roughly 9-11 analysts contribute.
Visible Alpha broker models via S&P Xpressfeed · 6 brokers · 361 line items · freshest revision 2026-07-24.
Broker models frame Allegion as an Americas-centric, high-margin hardware franchise whose growth is quietly changing character: the pricing that carried the top line through the inflation years fades across FY-2027 and FY-2028 while volume is modeled to take over, and acquisition contribution rolls off toward zero. Americas supplies the bulk of revenue at roughly double the margin of International, which the models see slipping organically before recovering. Coverage is fresh but modest at four to six brokers, so treat forward-year detail as a small-panel view.
Growth engine shifts from price to volume as M&A rolls off
Pricing did the work in FY-2025 and FY-2026; from FY-2027 the models lean on volume instead, with acquisition and forex contribution fading toward zero. The organic rate holds broadly steady even as its mix inverts, which is a quality signal only if the modeled volume actually shows up.
| Line | FY-2025A | FY-2026E | FY-2027E | FY-2028E | YoY | Brokers |
|---|---|---|---|---|---|---|
| Growth bridge | — | — | — | — | — | — |
| Price impact - Total(%) | 2.9% | 3.1% | 1.5% | 1.3% | +0.2pt | 5 |
| Volume impact - Total(%) | 1.5% | 1.3% | 2.9% | 2.9% | -0.2pt | 5 |
| Acquisition / divestiture impact - Total(%) | 2.9% | 3.3% | 0.2% | 0.0% | +0.4pt | 6 |
| Forex Impact - Total(%) | 0.6% | 0.7% | -0.0% | 0.0% | +0.1pt | 6 |
| Net organic | — | — | — | — | — | — |
| Organic growth - Total(%) | 4.3% | 4.4% | 4.4% | 4.2% | +0.1pt | 6 |
Americas drives the top line and carries the margin; International lags then recovers
Americas is the franchise, contributing most of revenue at a high-20s EBITA margin versus International's low-teens. Models pencil International organic growth turning negative near-term before a FY-2027 recovery, so the consolidated path rests on Americas holding its pace.
| Line | FY-2025A | FY-2026E | FY-2027E | FY-2028E | YoY | Brokers |
|---|---|---|---|---|---|---|
| Revenue | — | — | — | — | — | — |
| Total revenue - America | $3.22bn | $3.48bn | $3.65bn | $3.81bn | +8.0% | 6 |
| Total revenue - International | $847.00m | $927.80m | $959.01m | $991.45m | +9.5% | 6 |
| Organic growth | — | — | — | — | — | — |
| Organic growth - America(%) | 5.3% | 5.9% | 4.6% | 4.5% | +0.6pt | 6 |
| Organic growth - International(%) | 0.7% | -1.2% | 3.6% | 3.4% | -1.8pt | 6 |
| EBITA margin | — | — | — | — | — | — |
| EBITA margin - America - Operating(%) | 29.2% | 29.1% | 29.5% | 29.9% | -0.1pt | 6 |
| EBITA margin - International - Operating(%) | 13.7% | 12.9% | 13.8% | 14.2% | -0.7pt | 6 |
The debate is narrow on the P&L but real on the Americas growth path
The Americas FY-2027 organic range and the size of the volume rebound are where the models most diverge; the resulting operating-EPS spread by FY-2028 is the downstream consequence of that split.
| Line | Period | Median | Q1–Q3 | Min–max | Brokers |
|---|---|---|---|---|---|
| Organic growth - America(%) | FY-2027E | 5.0% | 4.0%–5.7% | 2.4%–6.1% | 4 |
| Volume impact - Total(%) | FY-2027E | 3.0% | 2.5%–3.4% | 1.5%–3.9% | 4 |
| EPS - Diluted - Operating($) | FY-2028E | $10.34 | $10.14–$10.64 | $9.67–$11.40 | 4 |
Margins still bend higher even as pricing fades
Consolidated EBITA margin is modeled to expand modestly each year through FY-2028, led by Americas. That implies mix and productivity, not price, carry incremental profitability once pricing normalizes.
Coverage is fresh but thins to four brokers in the forward years
Estimates were revised through late July 2026, so the panel is current, but forward-year and segment-detail dispersion reflects a small set of brokers. Read wide ranges as thin coverage rather than genuine conviction.
Headline P&L consensus, momentum and beat/miss live in the CapIQ tab.
Source: S&P Capital IQ transcripts via Xpressfeed · latest indexed call 2026-07-23 · generated 2026-07-27.
Latest call digest
Allegion plc, Q2 2026 Earnings Call, Jul 23, 2026 · 2026-07-23T12:00:00
Q2 2026 call — July 23, 2026. Prepared remarks were upbeat on the Americas: strong organic growth (enterprise organic revenue up 6.9%, reported up 12.7%), a return to Americas margin expansion (adjusted operating margin 24.2%), and raised full-year outlooks — reported revenue to 7.5% to 8.5%, organic to 3.5% to 4.5%, and adjusted EPS to $8.85 to $9.00. Management framed nonresidential spec activity as the strongest since John Stone joined and highlighted data centers (approaching ~5% of non-res) and higher-ed electronics upgrades.
The Q&A reality was more two-sided. The standout was a much stronger-than-expected Americas residential quarter, which management repeatedly declined to extrapolate — attributing it to electronics sell-through, noting normal retailer inventory, a late-May price increase that pulled some June orders forward, and a tougher Q3 comp. On the other side, Europe weakened: management flagged deteriorating German demand and $10 million of annual restructuring benefit, and cut the International full-year outlook to a low single-digit organic decline. Guidance actually stated: EPS $8.85 to $9.00, International FY cut, ~$10M restructuring benefit (full run-rate in Q4), and no incremental buyback in the outlook (85.9 million share count).
Participant coverage from the latest call.
| Group | Participants | Count |
|---|---|---|
| Management | Operator; Joshua Pokrzywinski — Vice President of Investor Relations, Allegion plc; John Stone — President, CEO & Director, Allegion plc; Michael Wagnes — Senior VP & CFO, Allegion plc | 4 |
| Analysts | Timothy Wojs — Senior Research Analyst, Robert W. Baird & Co. Incorporated, Research Division; Alexander Virgo — Research Analyst, Evercore ISI Institutional Equities, Research Division; Rafe Jadrosich — Director in Equity Research and Homebuilder & Building Products Analyst, BofA Securities, Research Division; Jeffrey Sprague — Founder & Managing Partner, Vertical Research Partners, LLC; Tomohiko Sano — Managing Director, JPMorgan Chase & Co, Research Division | 5 |
Curated latest-call exchanges; one row per analyst topic.
| Analyst | Firm | Topic | What changed in Q&A |
|---|---|---|---|
| Timothy Wojs | Robert W. Baird & Co. Incorporated, Research Division | Americas volumes and spec activity | Pressed what drove the stronger-than-expected Q2 volumes and asked for a read on spec-quoting trends over recent quarters; management cited broad-based non-res strength and a residential upside it would not extrapolate, and declined to quantify spec. |
| Alexander Virgo | Evercore ISI Institutional Equities, Research Division | Europe / Germany demand | Asked why a competitor reported accelerating European growth while Allegion flagged deterioration; management pointed to its outsized Germany exposure and a sequentially worsening German macro. |
| Rafe Jadrosich | BofA Securities, Research Division | Residential surge sustainability | Probed prebuy versus sell-through on the residential acceleration; management said retailer inventories were normal and demand was real, but the outlook does not assume that level continuing, and flagged a tougher prior-year comp. |
| Jeffrey Sprague | Vertical Research Partners, LLC | European restructuring scope and savings | Asked the nature, scope and savings of the Europe restructuring; management said actions were completed and quantified roughly $10 million of annual cost benefit, with full run-rate in Q4. |
| Tomohiko Sano | JPMorgan Chase & Co, Research Division | Non-res verticals and data centers | Sought vertical detail behind high-single-digit non-res growth and data-center differentiation; management described broad-based demand, cyclical recovery in office/multifamily, and data centers approaching ~5% of non-res. |
Theme tracker
Themes are curator-classified across supplied calls.
| Theme | Status | Quarters mentioned | Read-through |
|---|---|---|---|
| Americas nonresidential strength and rising spec activity | persisted | Q4 2024, Q1 2025, Q2 2025, Q3 2025, Q4 2025, Q1 2026, Q2 2026 | The single most consistent pillar of the story. Management has described spec activity as growing since 2024 and, by Q2 2026, the strongest in the CEO's tenure, framed as support for non-res growth over the next couple of years. |
| Residential market softness | persisted | Q4 2024, Q1 2025, Q2 2025, Q3 2025, Q4 2025, Q1 2026, Q2 2026 | Resi was described as soft for most of the window on weak new build and high rates. The Q2 2026 electronics-driven jump was a notable exception, but management explicitly declined to treat one quarter as a trend. |
| Electronics as a long-term growth driver | persisted | Q4 2024, Q1 2025, Q2 2025, Q3 2025, Q4 2025, Q1 2026, Q2 2026 | Repeatedly cited as the structural outgrowth engine in both segments, with quarter-to-quarter variability acknowledged. Reaffirmed even when Q1 2026 electronics decelerated to mid-single digits. |
| Tariff-driven pricing to offset inflation | emerged | Q4 2024, Q1 2025, Q2 2025, Q3 2025, Q4 2025, Q1 2026, Q2 2026 | Entered the narrative as potential Mexico tariffs in the Q4 2024 call and became a central topic through 2025 into 2026. Consistent message: price and productivity cover inflation, with tariffs treated as EPS-neutral. |
| International ERP disruption and recovery | emerged | Q1 2026, Q2 2026 | A new, self-inflicted operational risk. Surfaced in Q1 2026 as the main driver of the International miss; management framed it as execution, not demand, and reported sequential margin recovery in Q2 2026. |
| Disciplined M&A and balanced capital deployment | persisted | Q4 2024, Q1 2025, Q2 2025, Q3 2025, Q4 2025, Q1 2026, Q2 2026 | A recurring standard slide. Roughly $630 million deployed in 2025, then a clear deceleration in 2026 (no acquisitions in Q2 2026) alongside more buyback commentary as shares were seen as attractively valued. |
| Quantified tariff surcharge revenue | dropped | Q2 2025, Q3 2025 | Management sized surcharge/tariff revenue at roughly $40 million in mid-2025, then shifted to list-price increases for 2026 and stopped quantifying a discrete surcharge figure. The disappearance reflects a change in pricing mechanics, not in the underlying inflation-offset approach. |
Guidance ledger
Quotes, calls, and speakers are source-verified; outcomes are curator-classified.
| Verbatim guidance | Call | Speaker | Curator outcome | Outcome note |
|---|---|---|---|---|
| “we are raising our organic revenue growth outlook to 3.5% to 4.5% and adjusted earnings per share outlook to $8.85 to $9.00” | Allegion plc, Q2 2026 Earnings Call, Jul 23, 2026 · 2026-07-23T12:00:00 | John Stone | pending | Current fiscal 2026 guidance; the year is not yet complete in the supplied call history. |
| “think of it as $10 million annually of cost benefit” | Allegion plc, Q2 2026 Earnings Call, Jul 23, 2026 · 2026-07-23T12:00:00 | Michael Wagnes | pending | European restructuring benefit; management said actions were completed with full run-rate expected in Q4 2026, not yet realized in the supplied history. |
| “Our adjusted EPS outlook is $8.70 to $8.90.” | Allegion plc, Q4 2025 Earnings Call, Feb 17, 2026 · 2026-02-17T13:00:00 | John Stone | pending | Initial fiscal 2026 EPS guide. Affirmed on the Q1 2026 call and raised to $8.85 to $9.00 on the Q2 2026 call; full-year result not in the supplied history. |
| “We're estimating an adjusted earnings per share outlook in the range of $7.65 to $7.85.” | Allegion plc, Q4 2024 Earnings Call, Feb 18, 2025 · 2025-02-18T13:00:00 | John Stone | kept | Initial fiscal 2025 EPS guide. It was raised through the year (to $8.00-$8.15 in Q2 2025 and $8.10-$8.20 in Q3 2025); reported adjusted EPS for the four quarters of 2025 summed above the original range. |
| “Our company estimates tariff costs of approximately $80 million in 2025.” | Allegion plc, Q1 2025 Earnings Call, Apr 24, 2025 · 2025-04-24T12:00:00 | John Stone | unknown | The estimate was revised down to roughly $40 million by the Q2 2025 call as tariff policy shifted; management continued to guide tariffs as EPS-neutral rather than confirming a final cost figure. |
Q&A pressure map
Question counts and firms are curator tallies; analyst coverage shown above.
| Topic | Questions | Firms | Pressure / response |
|---|---|---|---|
| Tariffs and price/cost offset | 6 | Goldman Sachs Group, Inc., Research Division, Wells Fargo Securities, LLC, Research Division, Vertical Research Partners, LLC, Mizuho Securities USA LLC, Research Division, Morgan Stanley, Research Division, Robert W. Baird & Co. Incorporated, Research Division | The most-pressed topic across 2025. Analysts from at least six firms repeatedly tested the price-cost lag, surcharge-versus-list mechanics, and the EPS-neutral claim; management held to the message that pricing and productivity would cover inflation on a dollar basis. |
| International ERP disruption and recovery | 4 | JPMorgan Chase & Co, Research Division, Vertical Research Partners, LLC, Evercore ISI Institutional Equities, Research Division, Goldman Sachs Group, Inc., Research Division | Concentrated in Q1 2026. Analysts pressed whether the Q1 shortfall would truly be recovered and whether International belongs in the portfolio; management insisted it was an execution issue, not demand, backed by orders and backlog. |
| Americas nonresidential and spec-to-revenue durability | 4 | Robert W. Baird & Co. Incorporated, Research Division, Wells Fargo Securities, LLC, Research Division, Goldman Sachs Group, Inc., Research Division, JPMorgan Chase & Co, Research Division | Analysts repeatedly sought quantification of spec activity and its read-through to future volumes. Management consistently declined to disclose specific spec numbers, citing the variable spec-to-revenue lag rather than avoiding the question. |
| Residential demand and the Q2 2026 surge | 3 | BofA Securities, Research Division, Vertical Research Partners, LLC, JPMorgan Chase & Co, Research Division | Analysts probed whether the strong Q2 2026 residential jump was a stocking or prebuy event; management attributed it to electronics sell-through with normal retailer inventory and declined to build it into the outlook. |
| Americas margin and mix cadence | 3 | Robert W. Baird & Co. Incorporated, Research Division, Barclays Bank PLC, Research Division, Morgan Stanley, Research Division | Analysts pressed the Q1 2026 negative product mix and the back-half-weighted margin expansion; management framed it as a first-quarter comp effect and reaffirmed core incrementals thereafter. |
Language shifts
Only language evidence verified against the referenced component is shown.
| Observation | Verbatim evidence | Call ID | Component |
|---|---|---|---|
| New operational-risk vocabulary entered the narrative in Q1 2026: management began attributing an International miss to a specific ERP implementation, language absent in prior calls. | “our Q1 organic revenue growth and margins in International were negatively impacted by an ERP implementation in one of our legacy mechanical businesses” | 1995382961 | 2 |
| Sharper caution on Europe in Q2 2026, a step beyond the earlier 'flattish/sluggish' framing toward describing an actively deteriorating market. | “The macro backdrop in Germany has just been worsening.” | 2009814741 | 16 |
| Rising confidence on non-res demand in Q2 2026, the most emphatic characterization of spec strength in the window. | “It's as strong as I've seen since I joined the company.” | 2009814741 | 11 |
| First explicit restructuring response to European weakness in Q2 2026, signaling a cost-action posture rather than the prior 'self-help' framing. | “we have taken additional restructuring actions in response” | 2009814741 | 2 |
The call history describes a two-speed business: a strengthening Americas nonresidential engine, backed by multi-quarter spec momentum and reliable price-to-offset-inflation execution, set against a genuinely weaker Europe and a self-inflicted International ERP stumble. Management's consistent refusal to extrapolate a single strong residential quarter, alongside a 2025 guide that was raised repeatedly and beaten, argues for taking its conservative framing at face value while watching whether the German deterioration deepens.