Allegion plc's management explains the business in its own materials. The slides below do the most of that work, pulled from the documents preserved in Sources. Each source link opens the complete presentation at that slide in a new tab.
Management's fullest statement of strategy, business model, segment economics and capital allocation — the fastest path to knowing Allegion. · Open the full document →
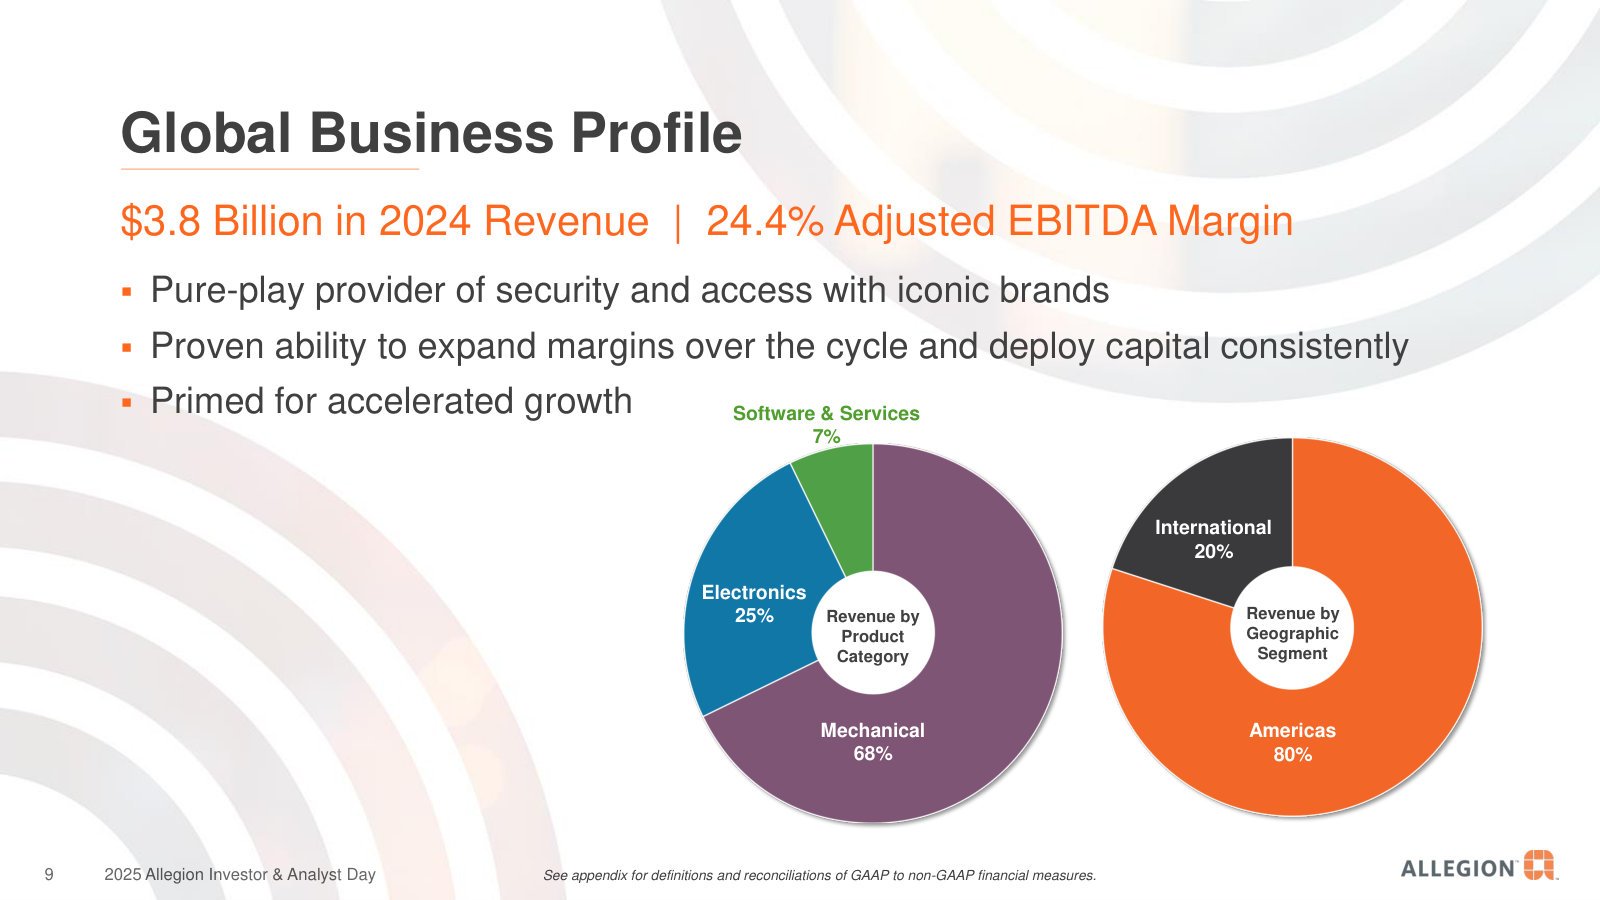
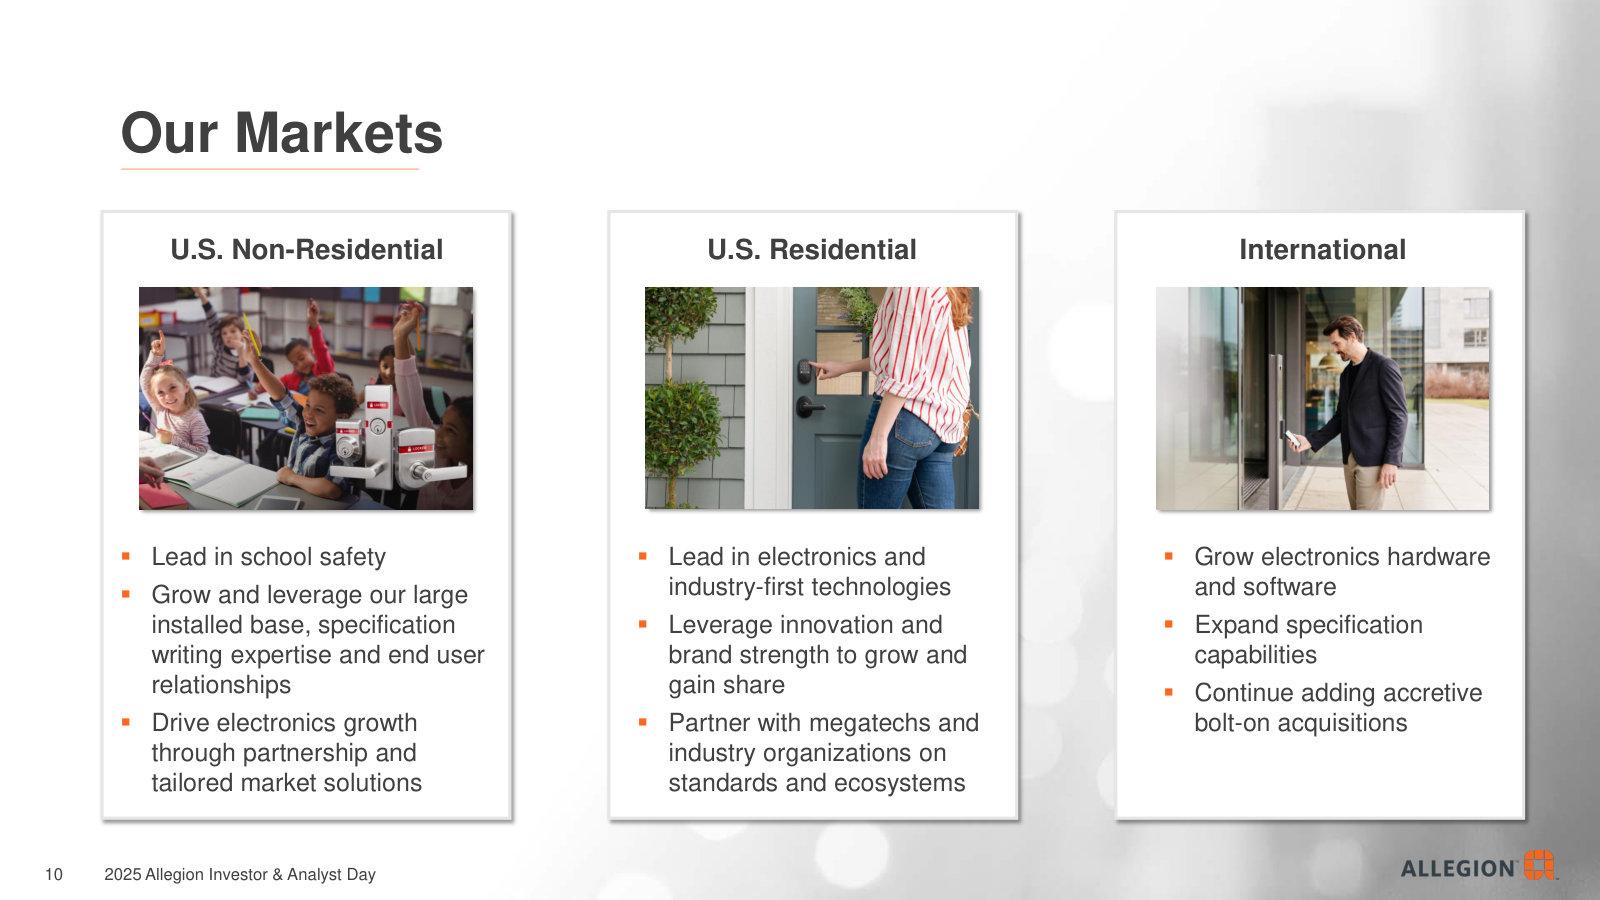
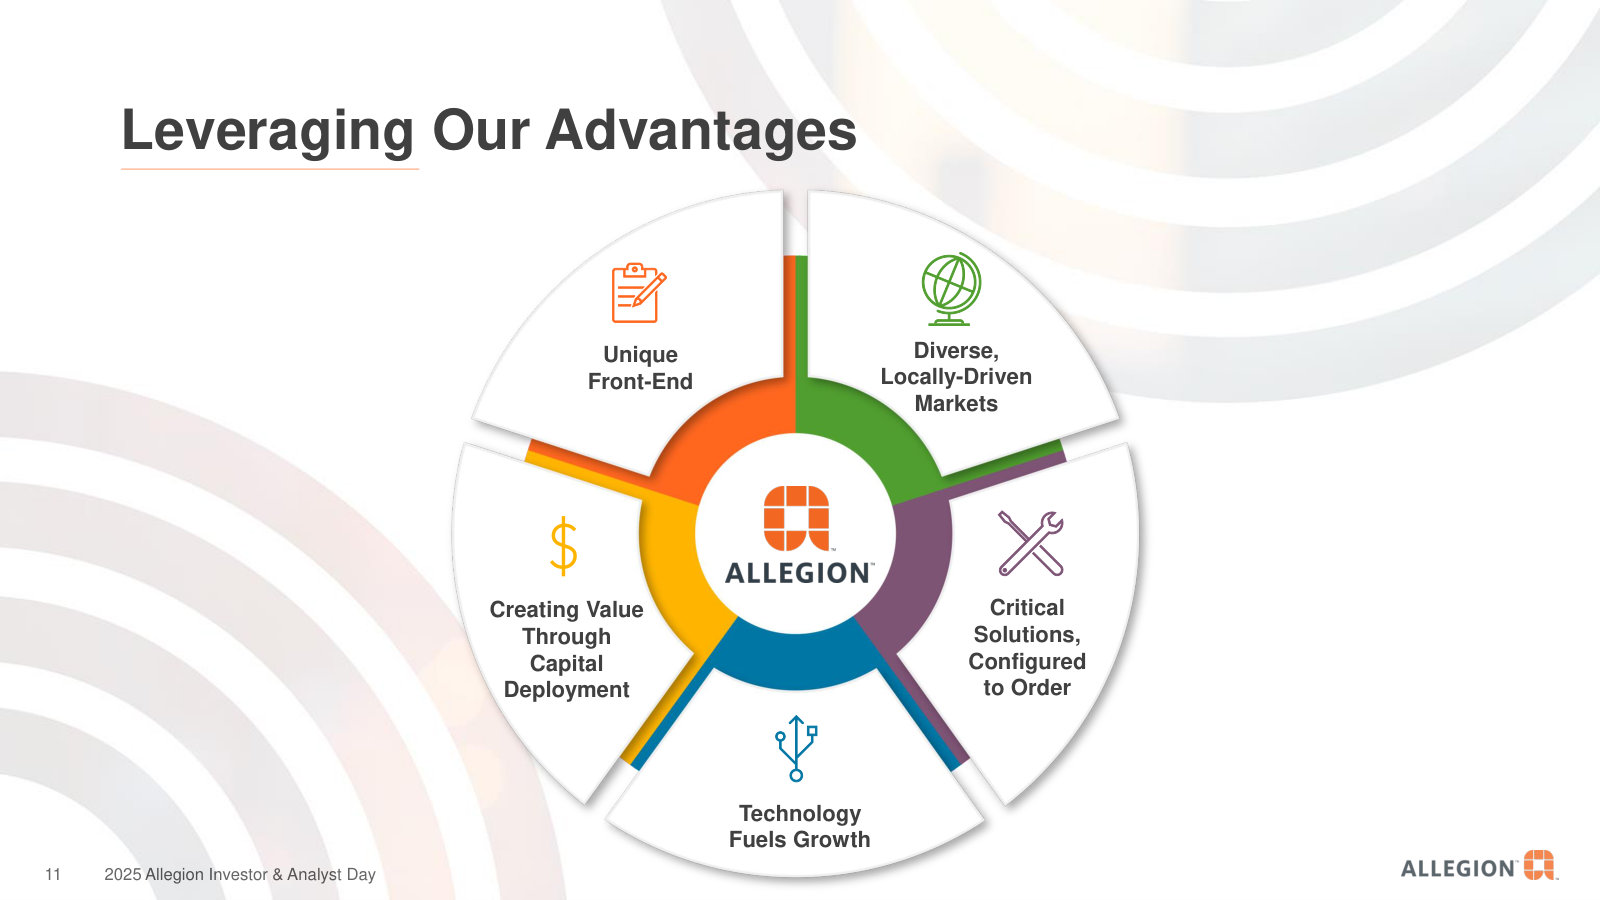
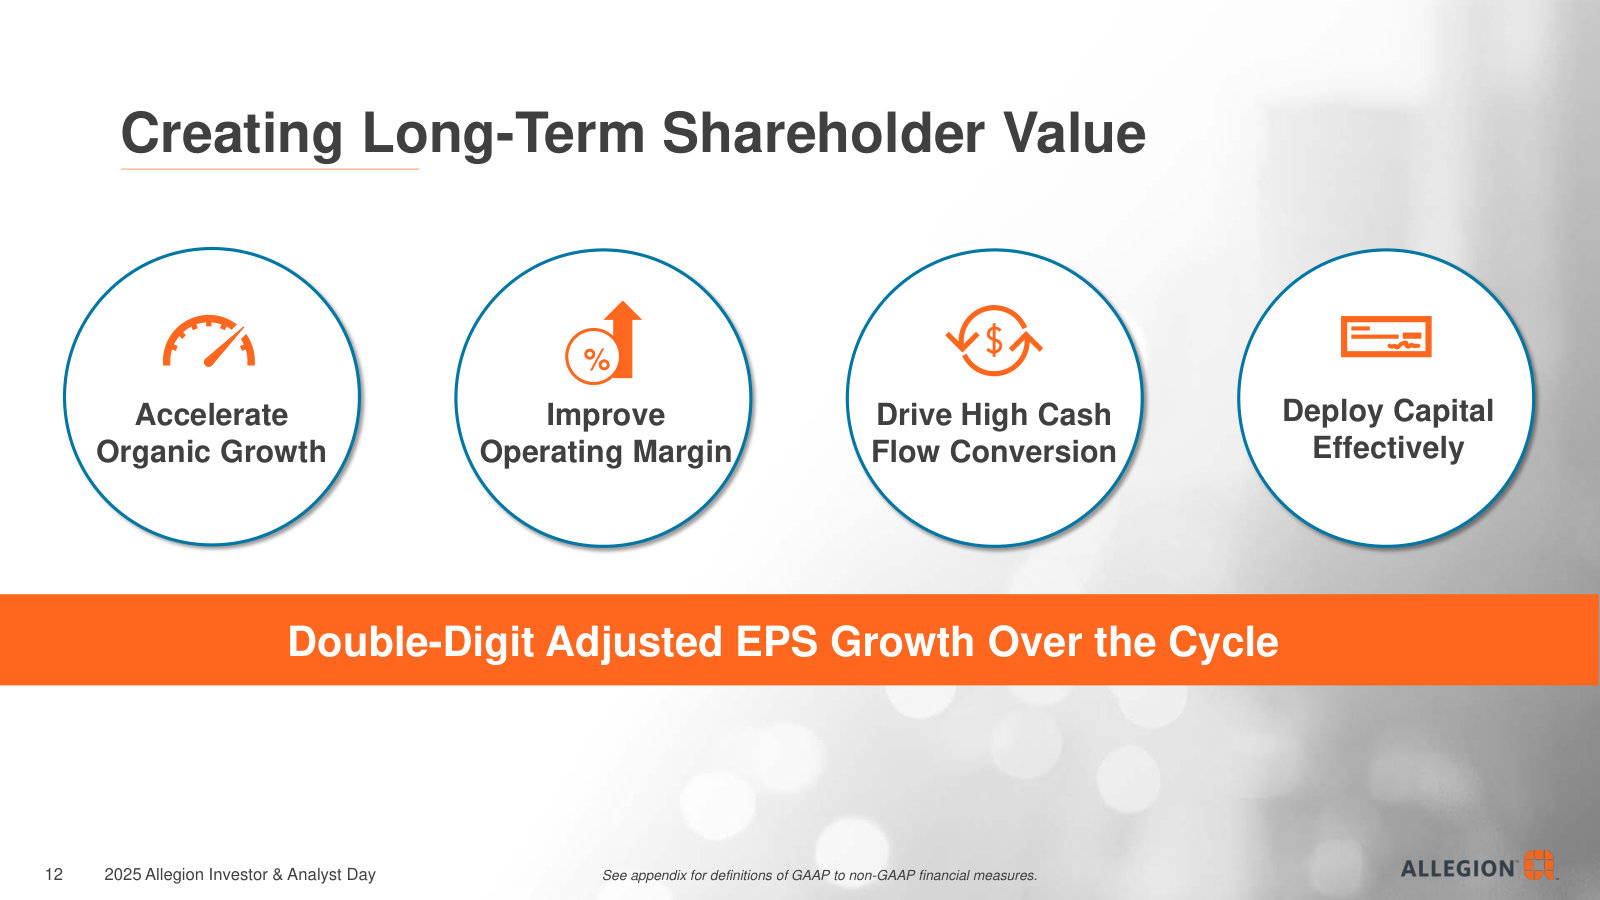
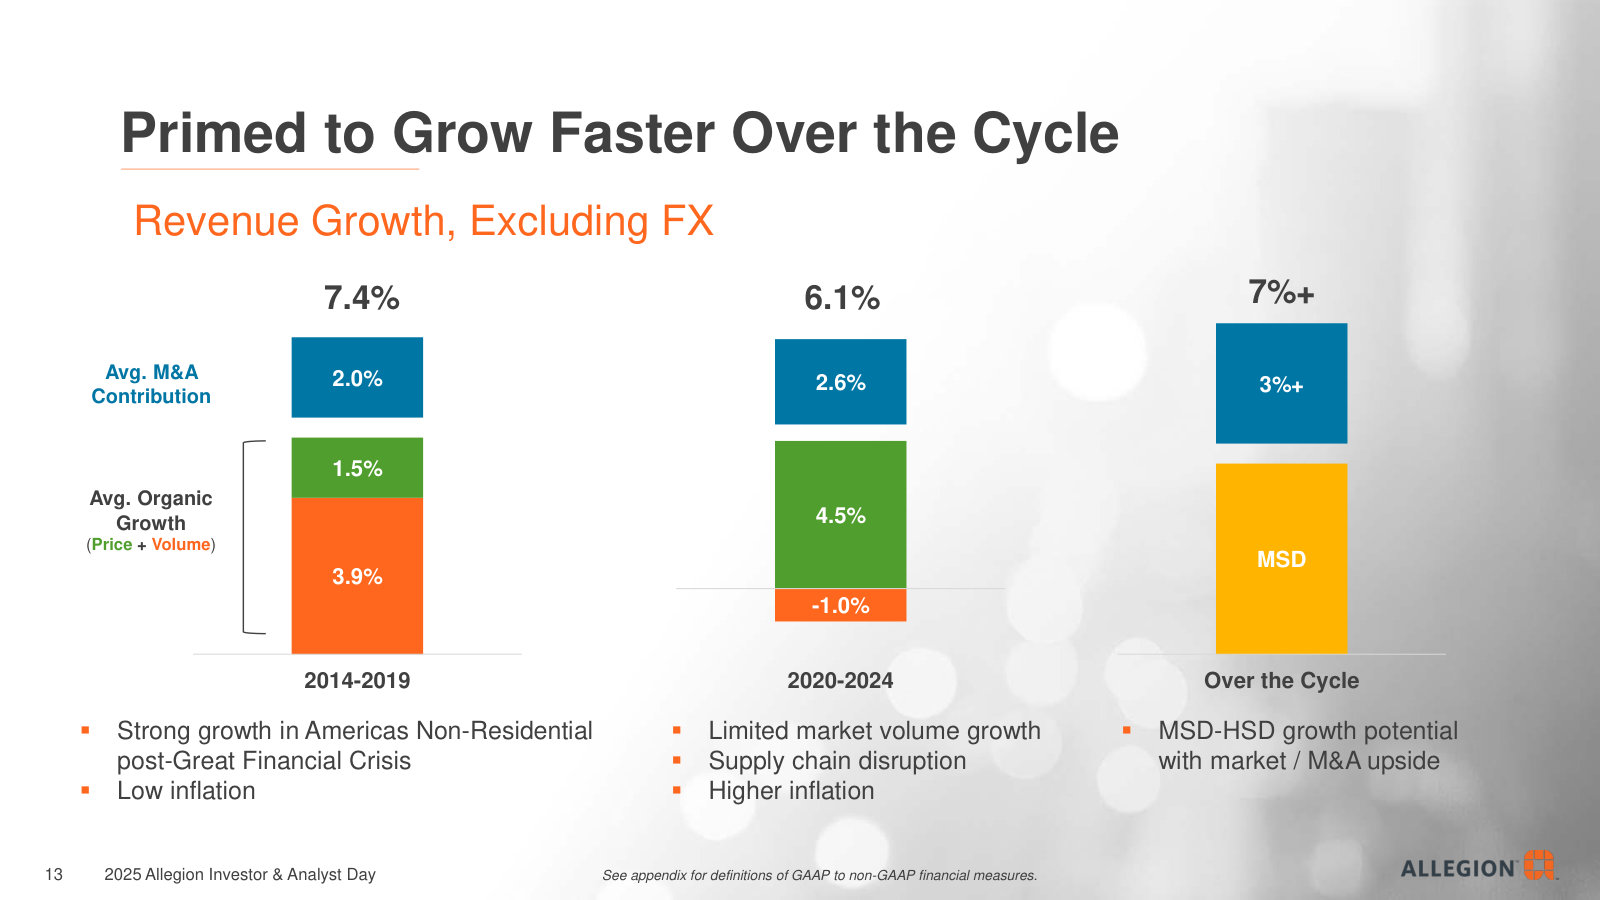
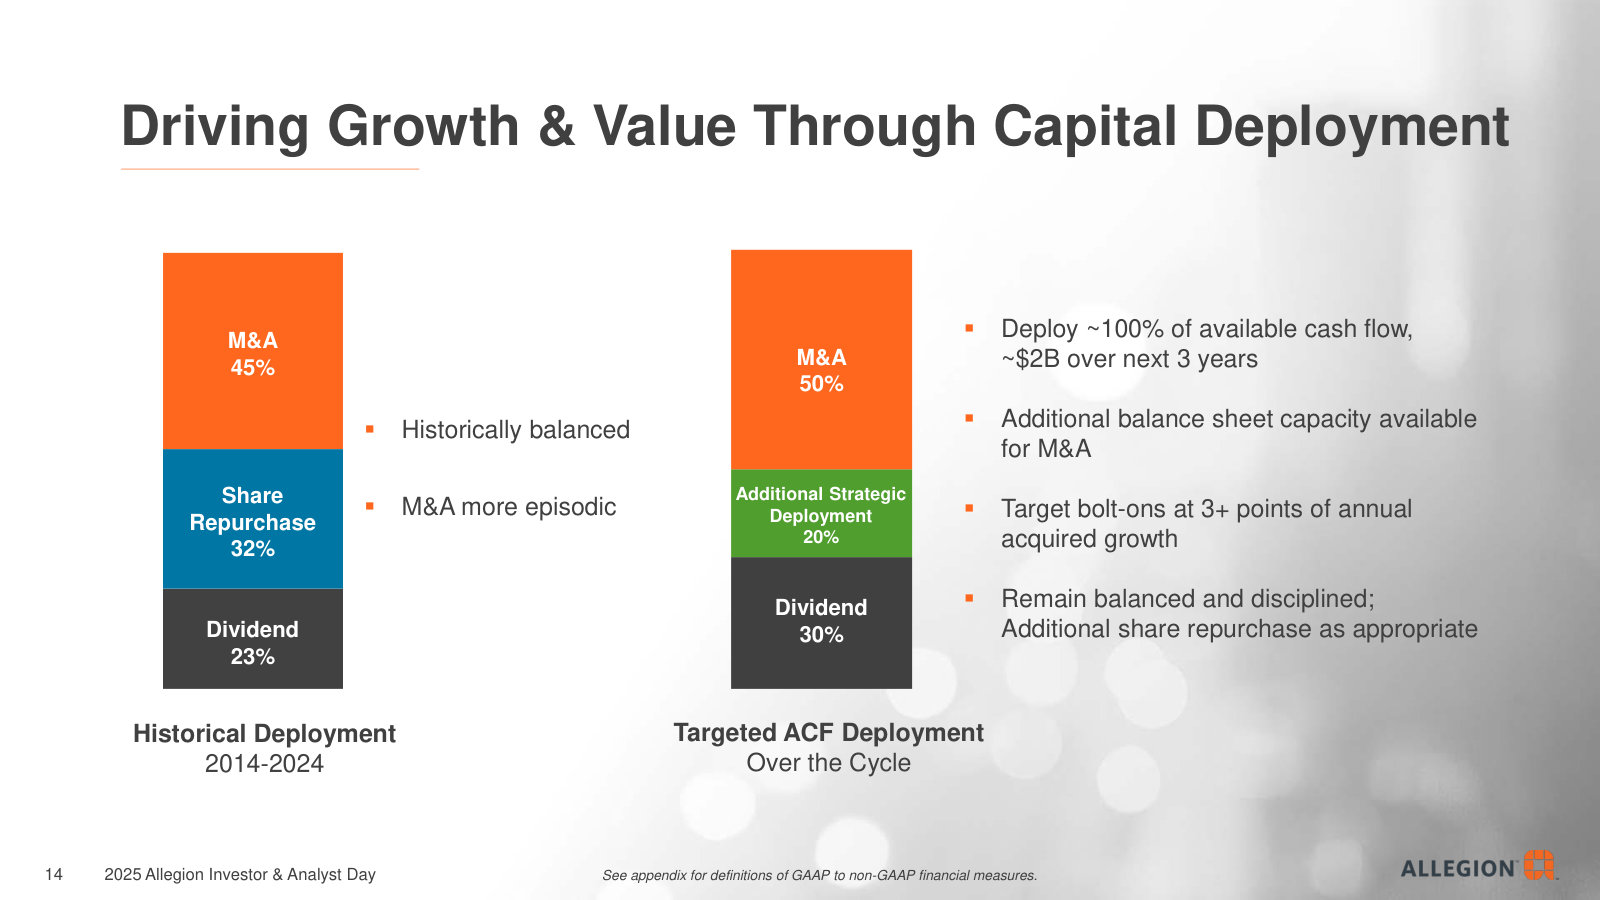
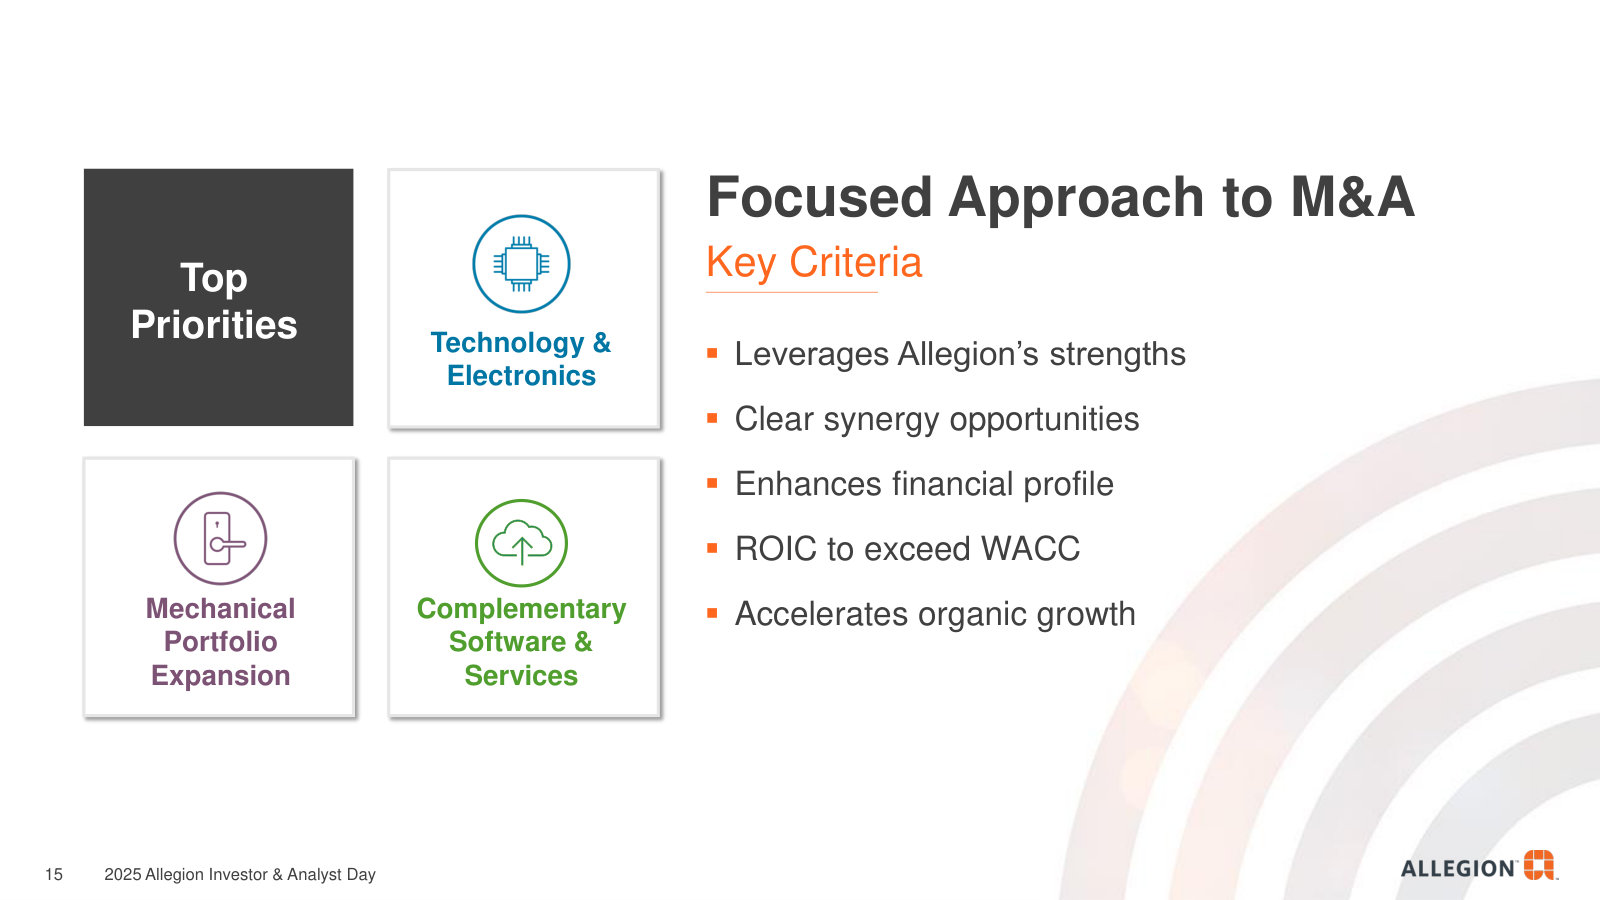
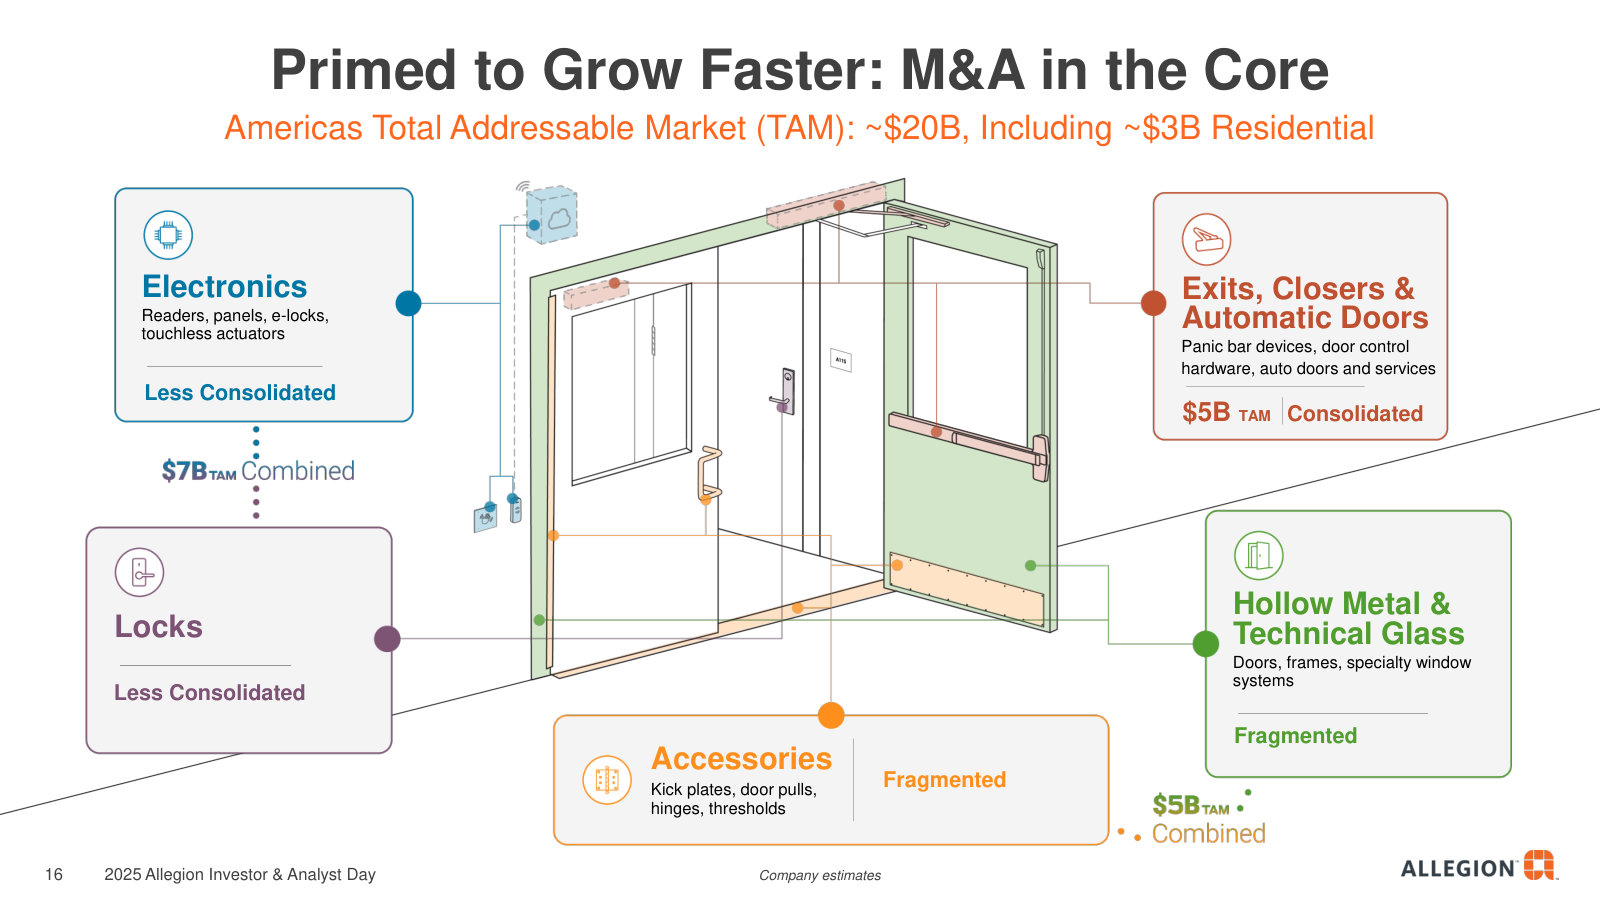
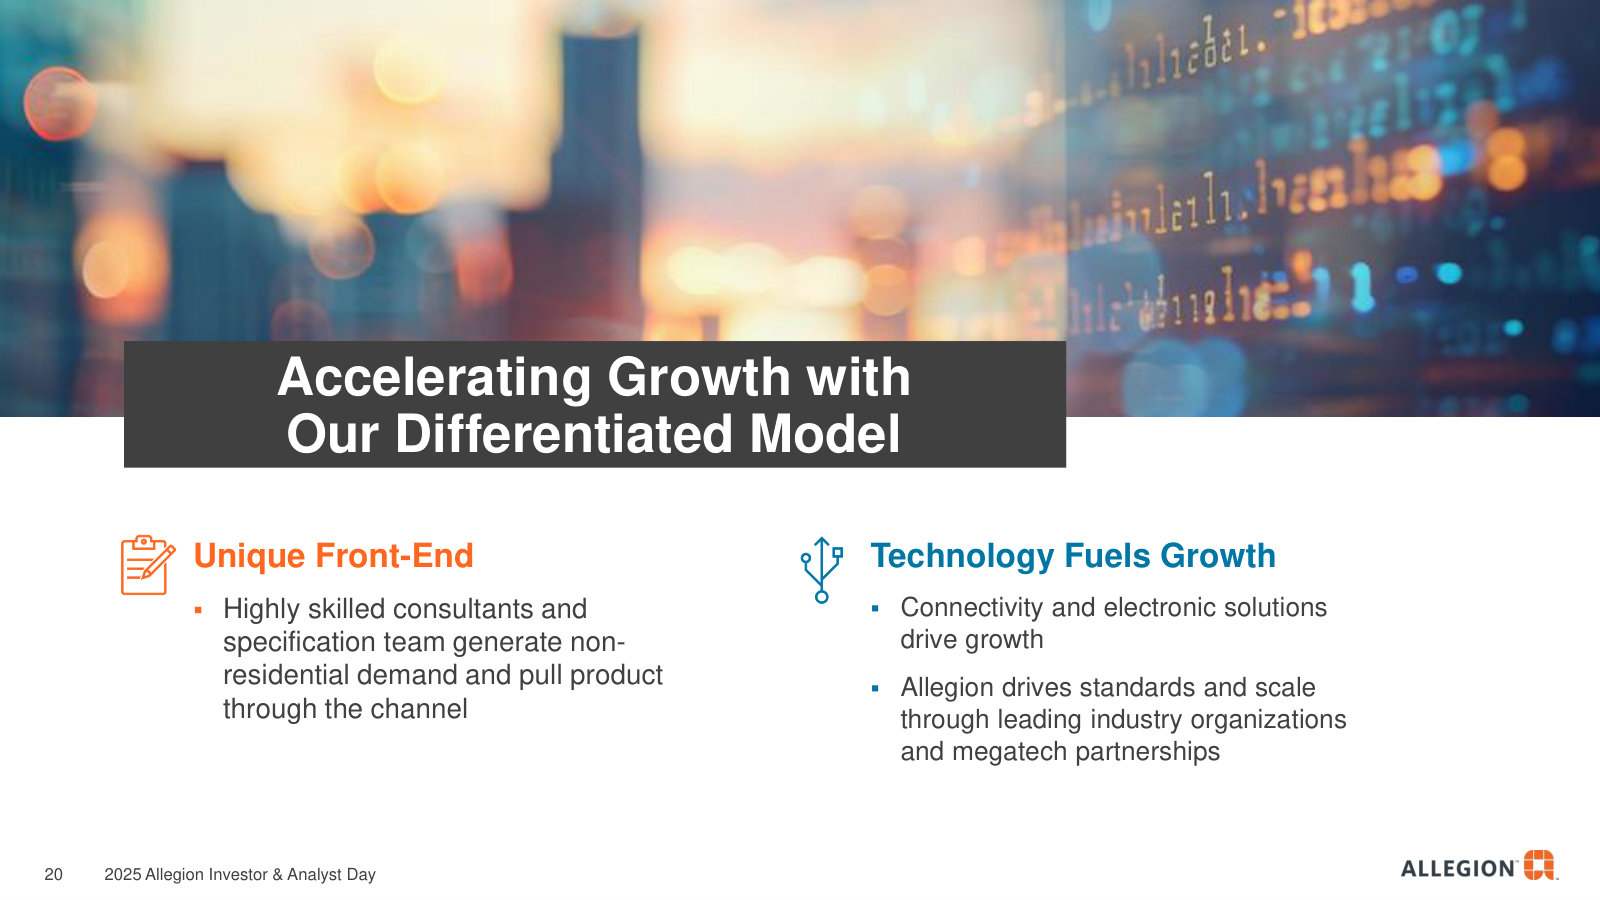
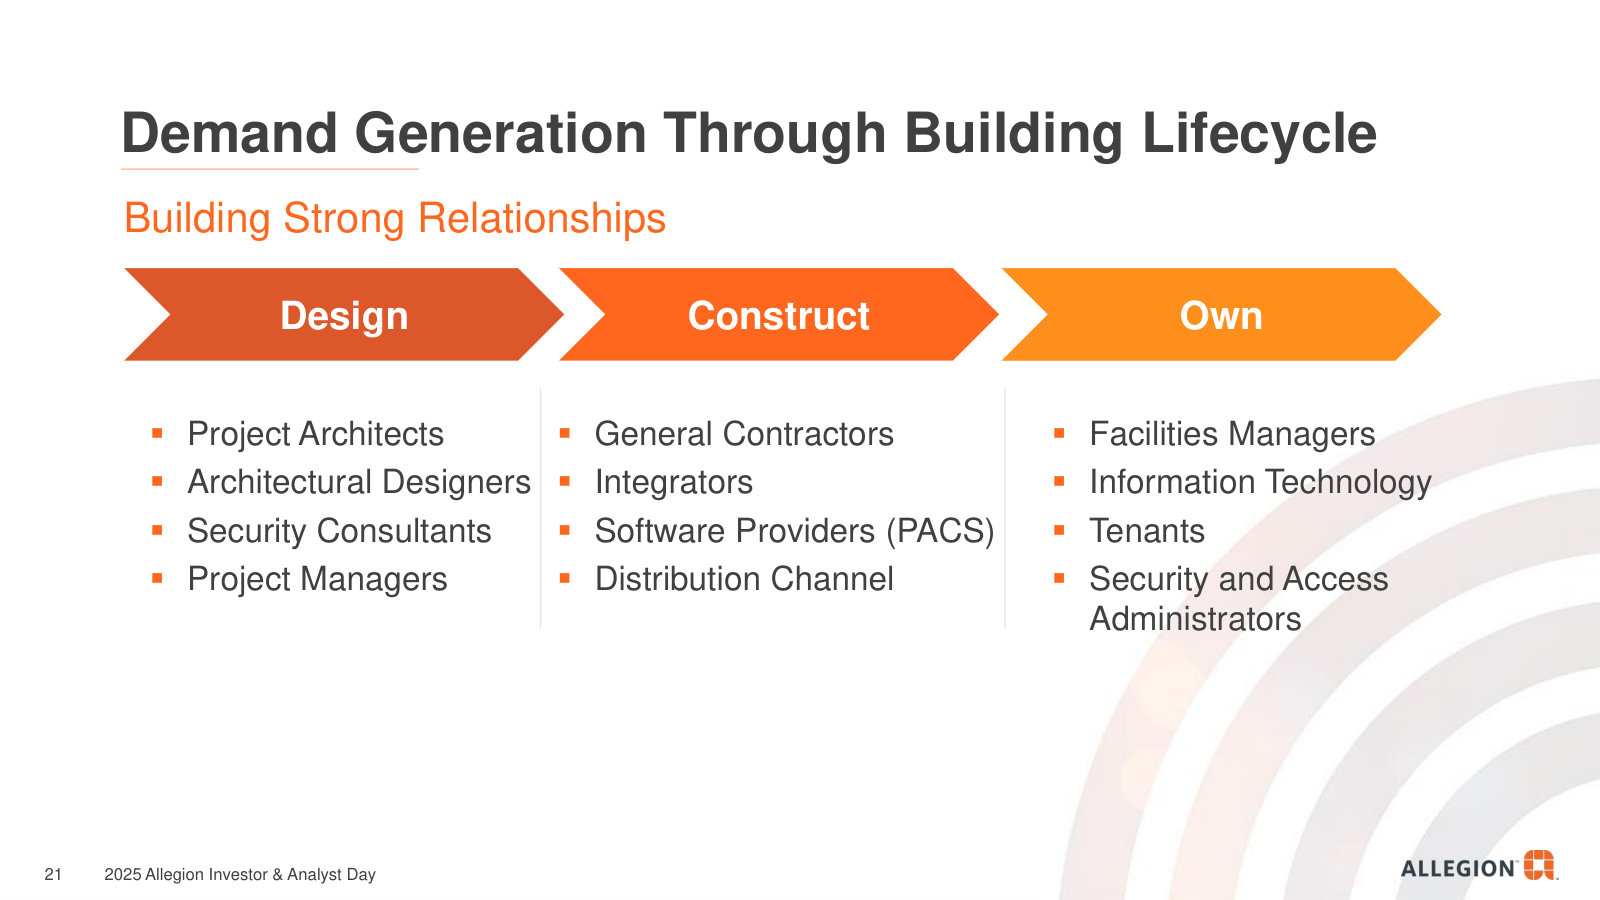
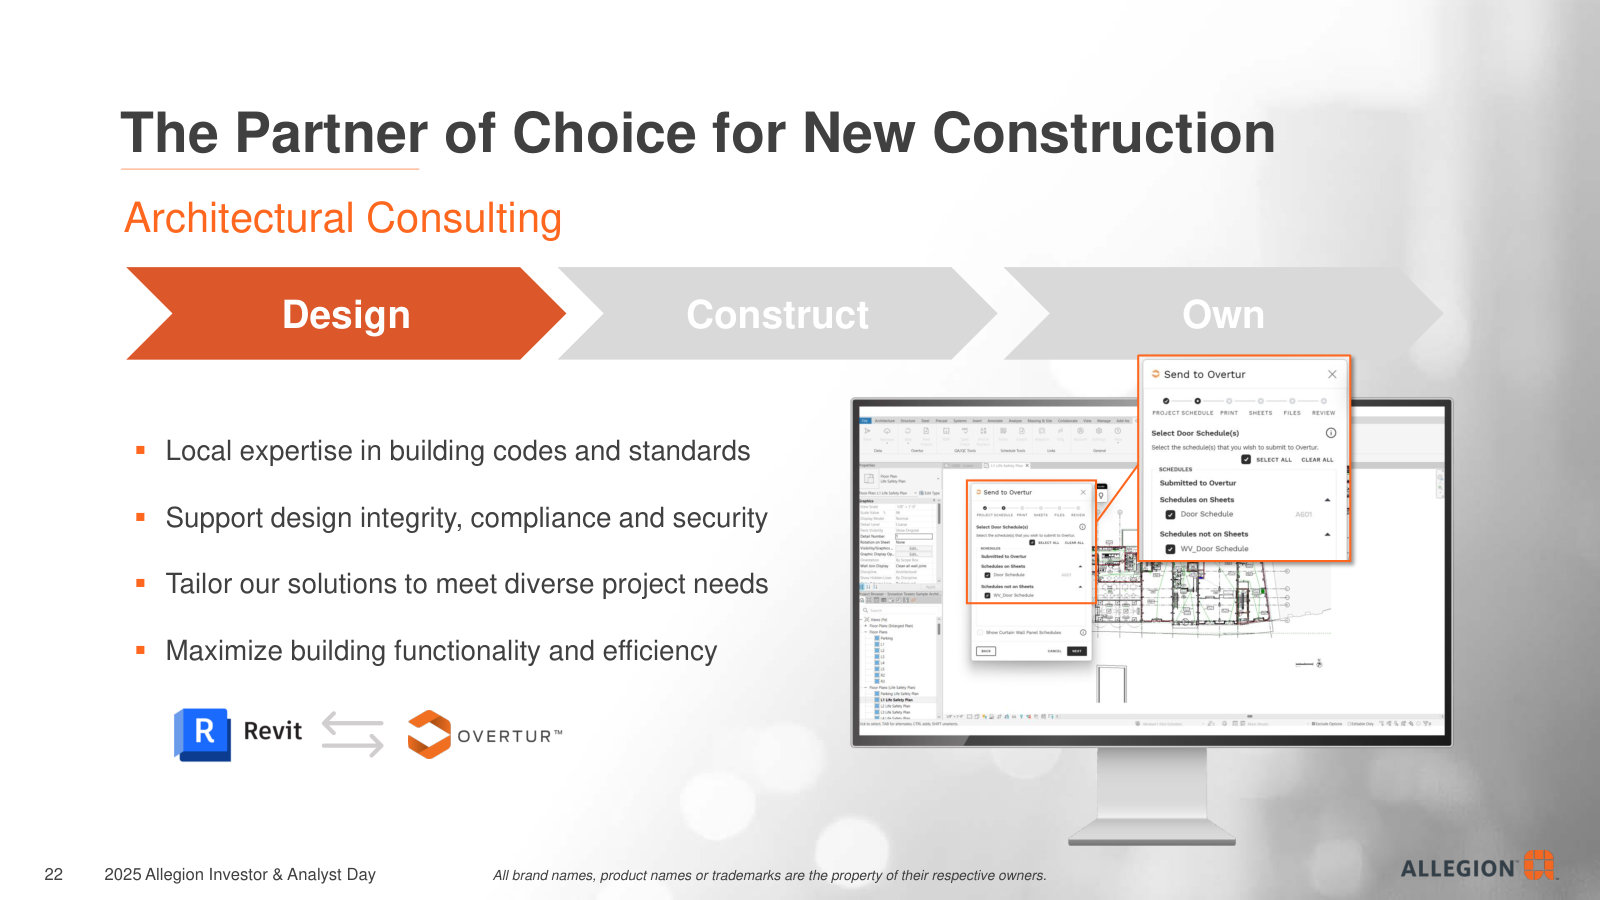
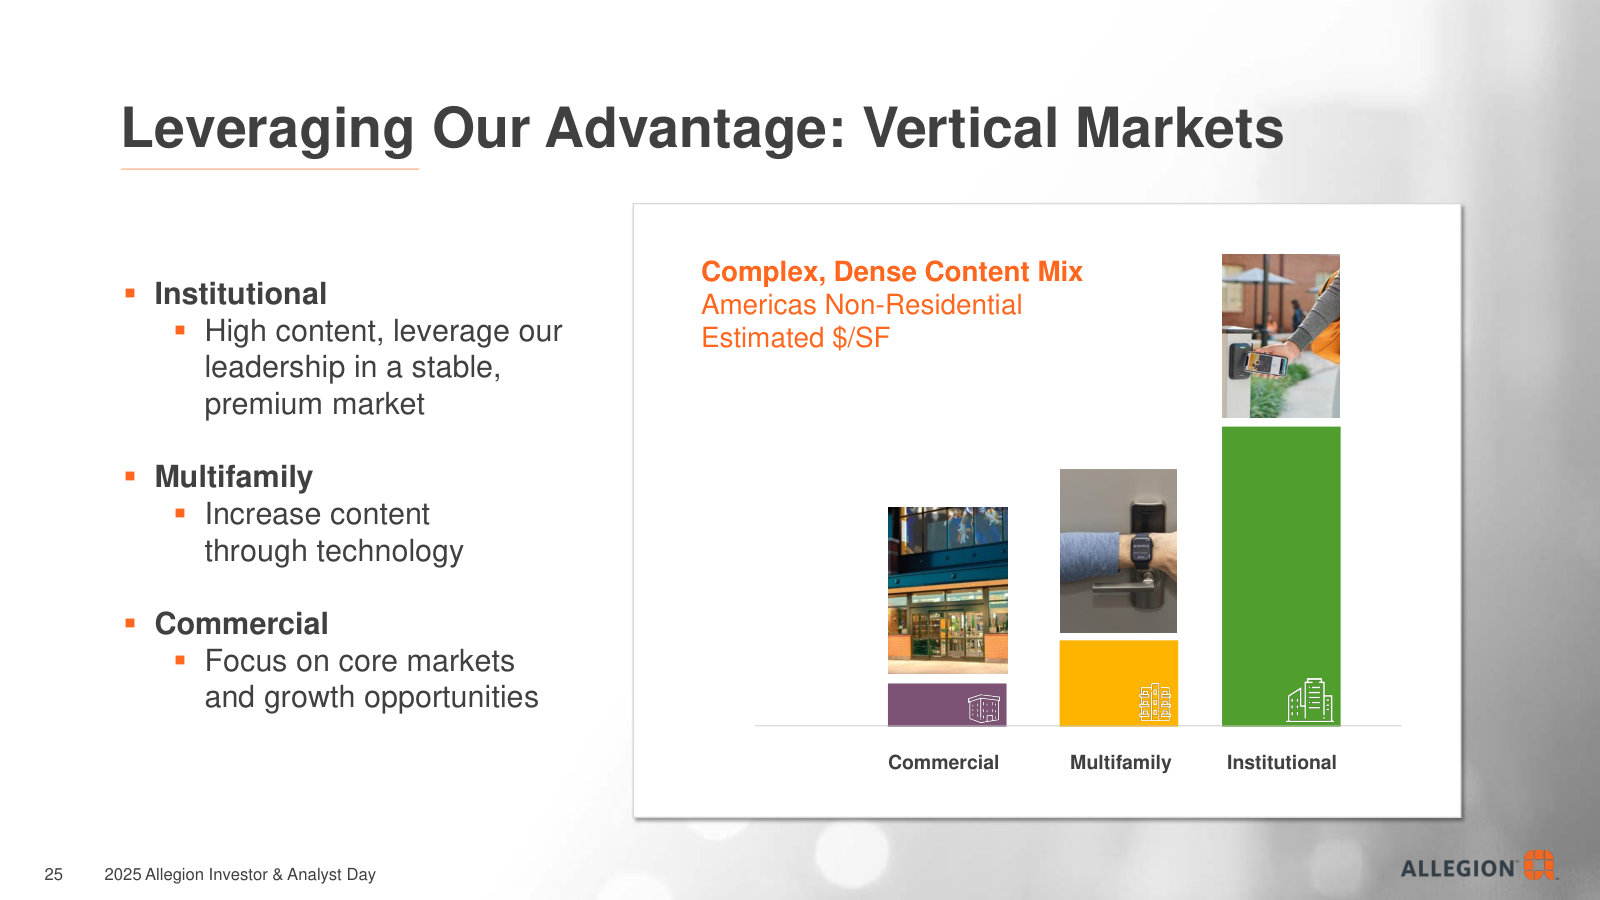
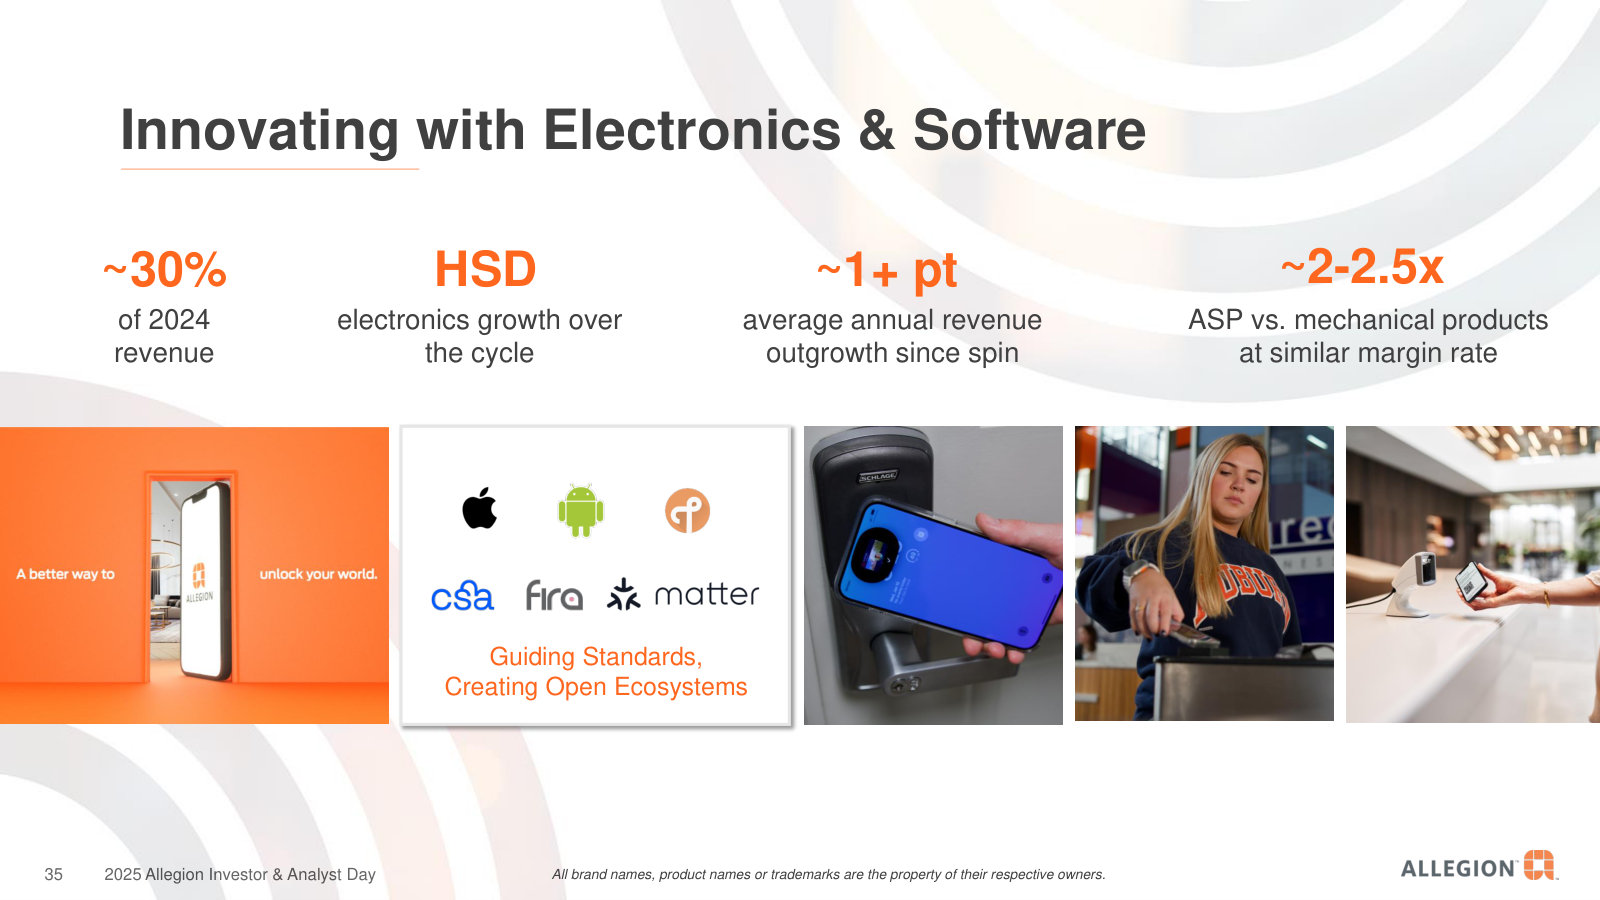
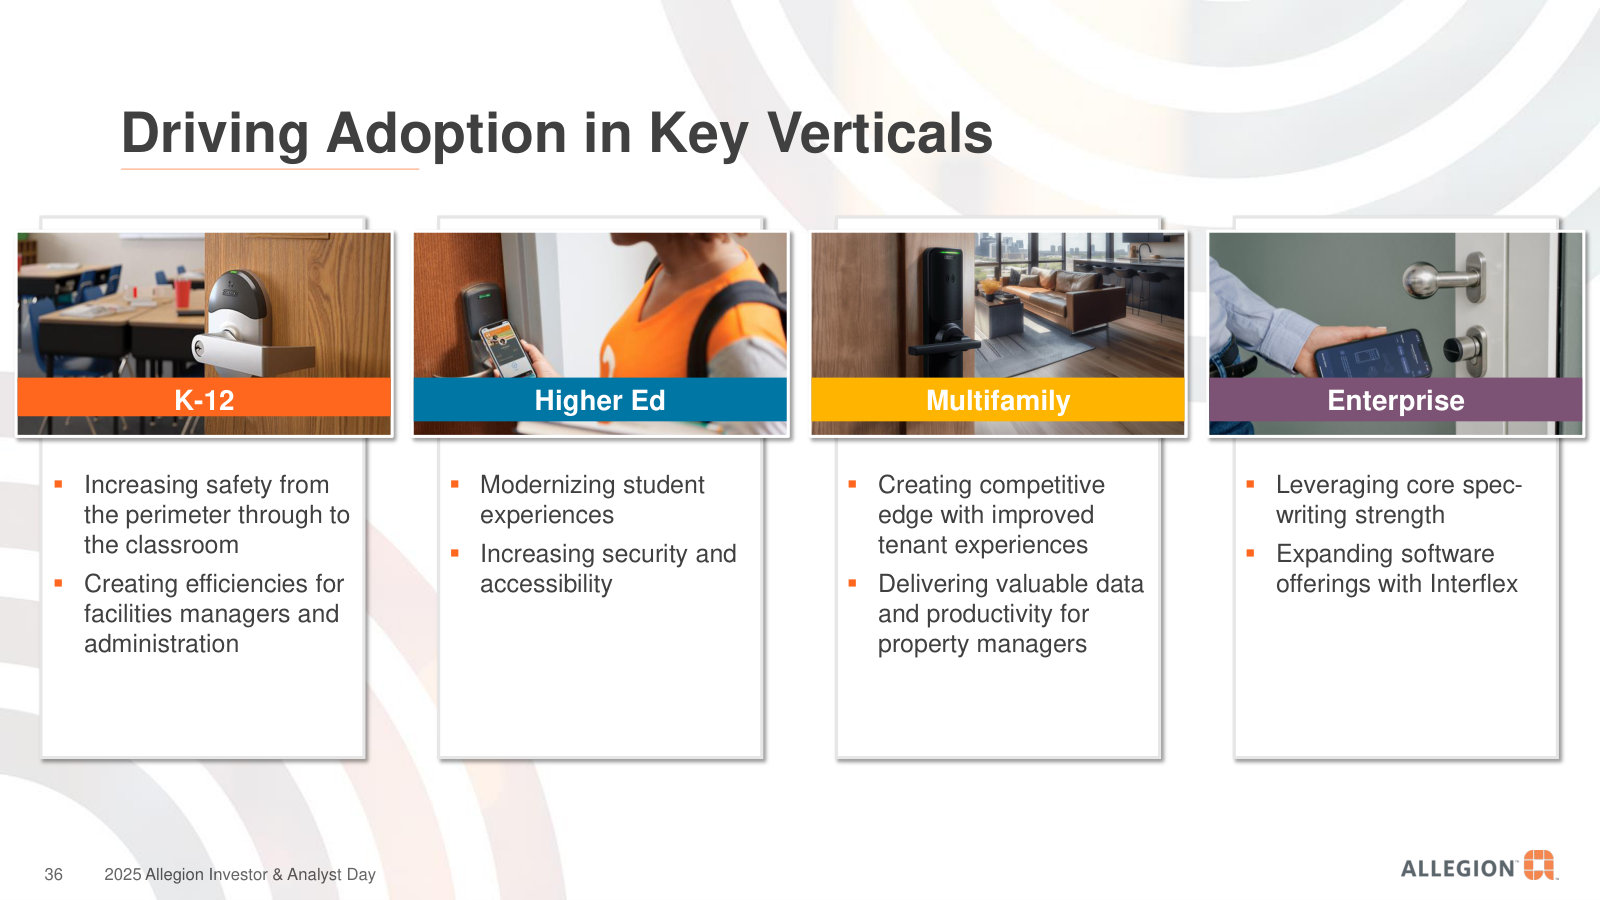
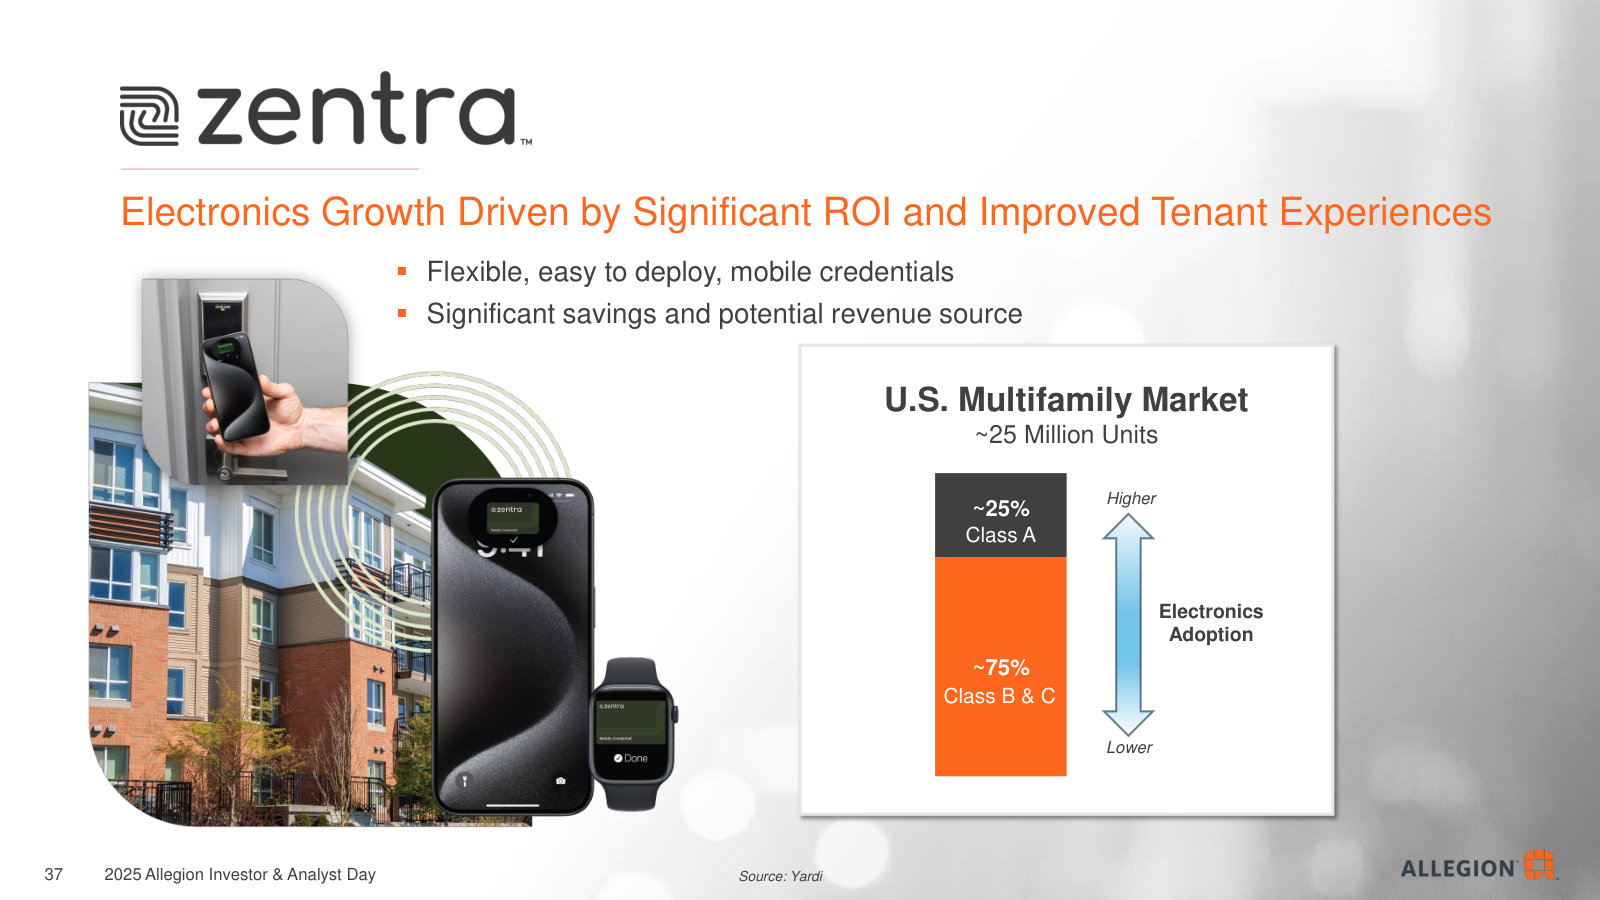
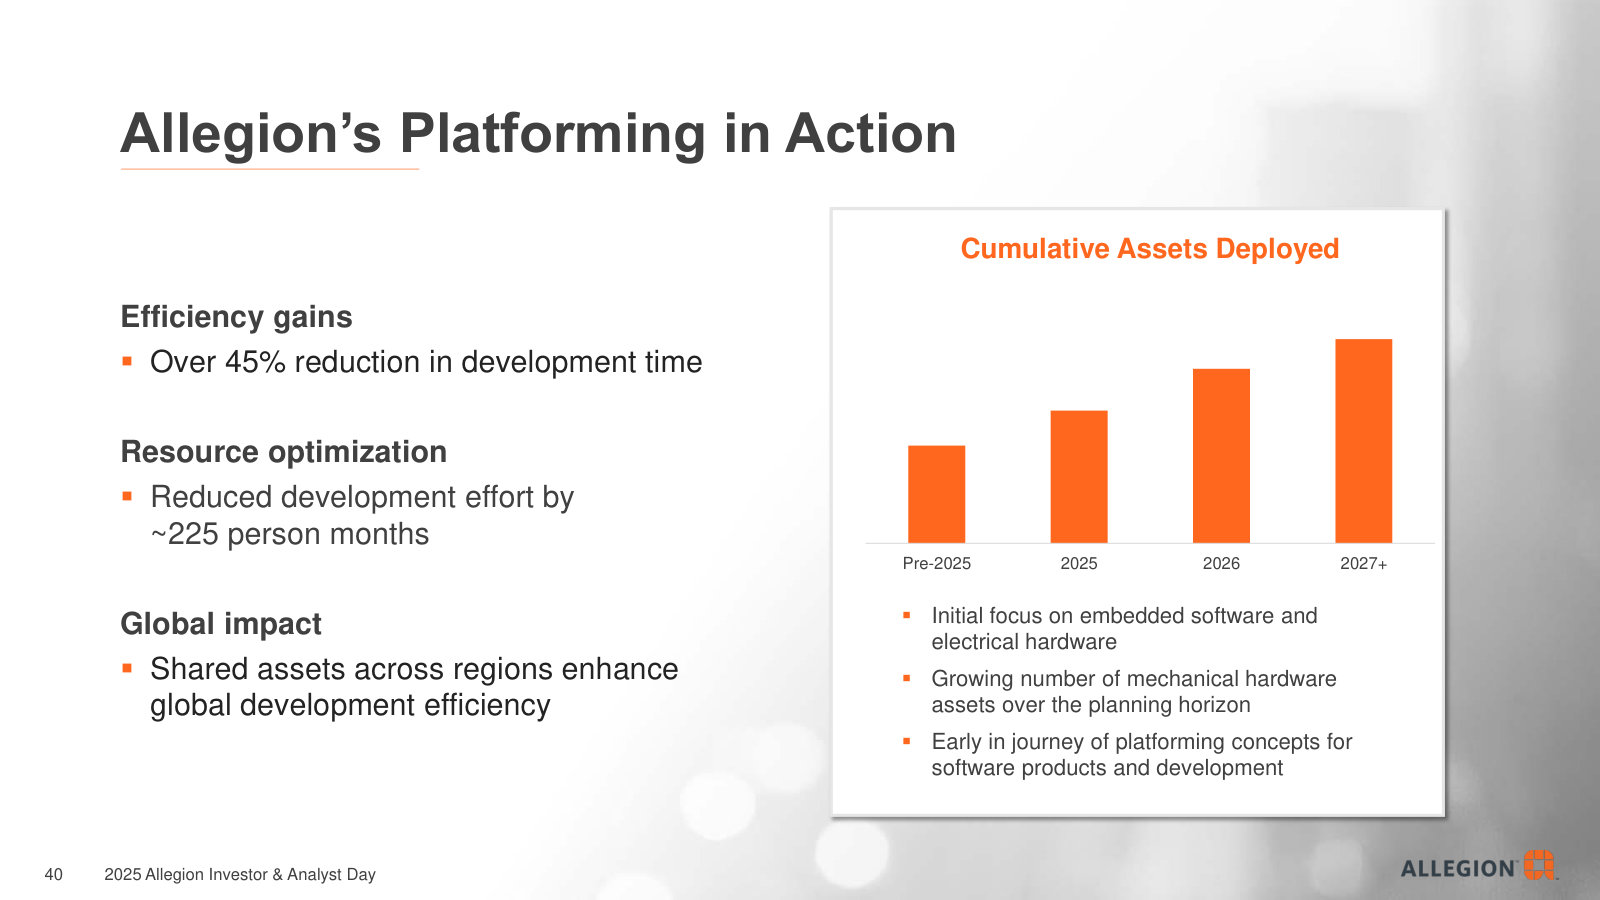
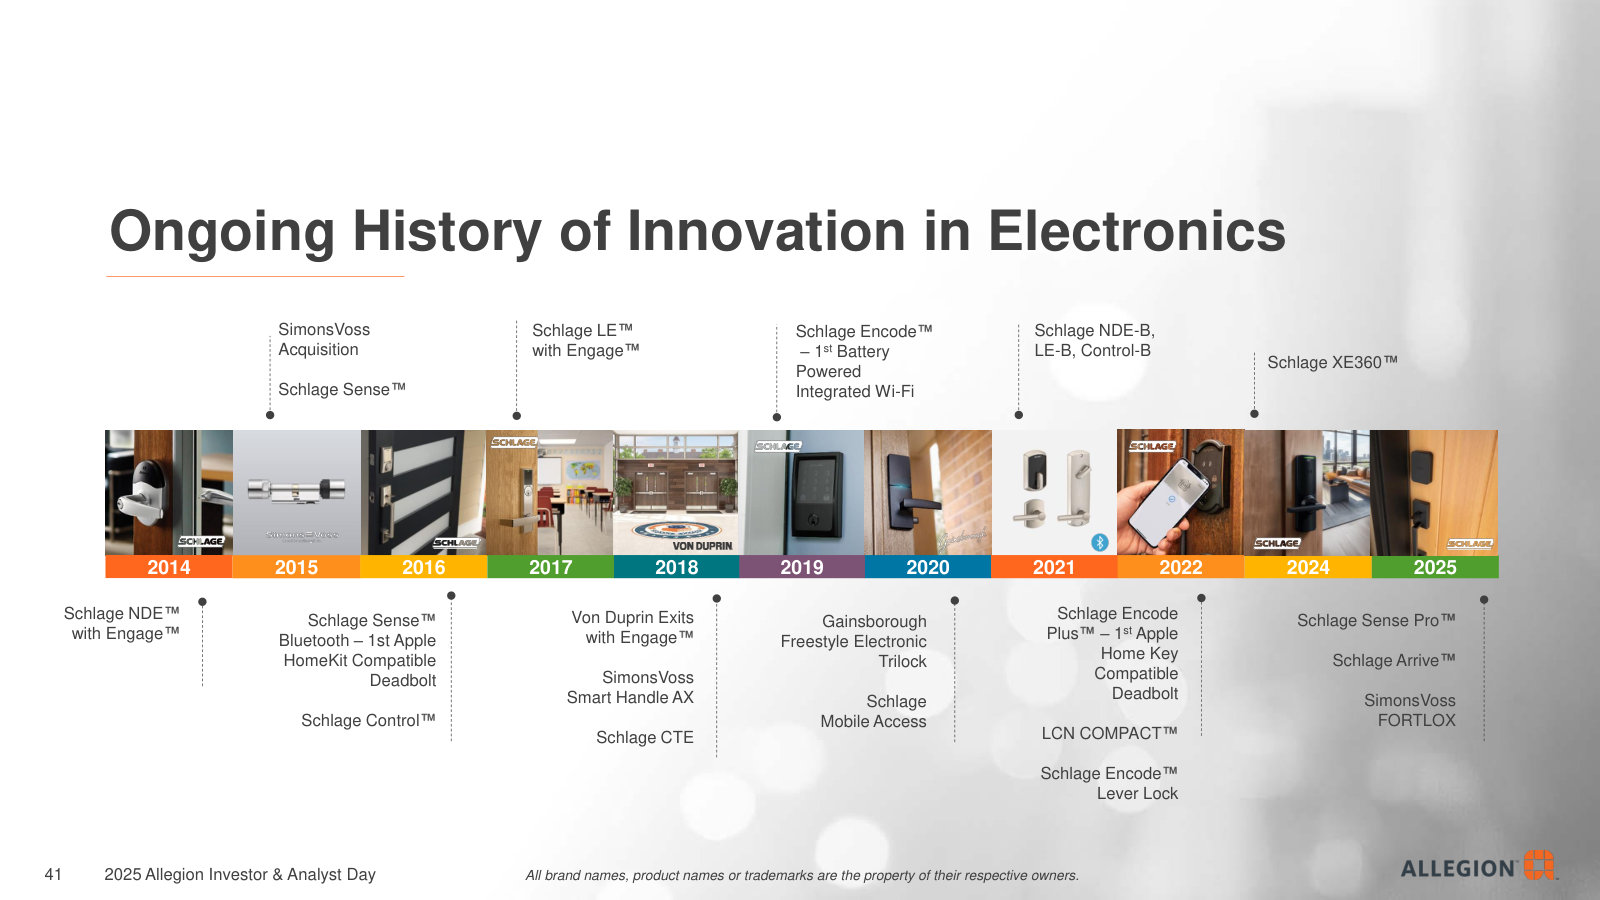
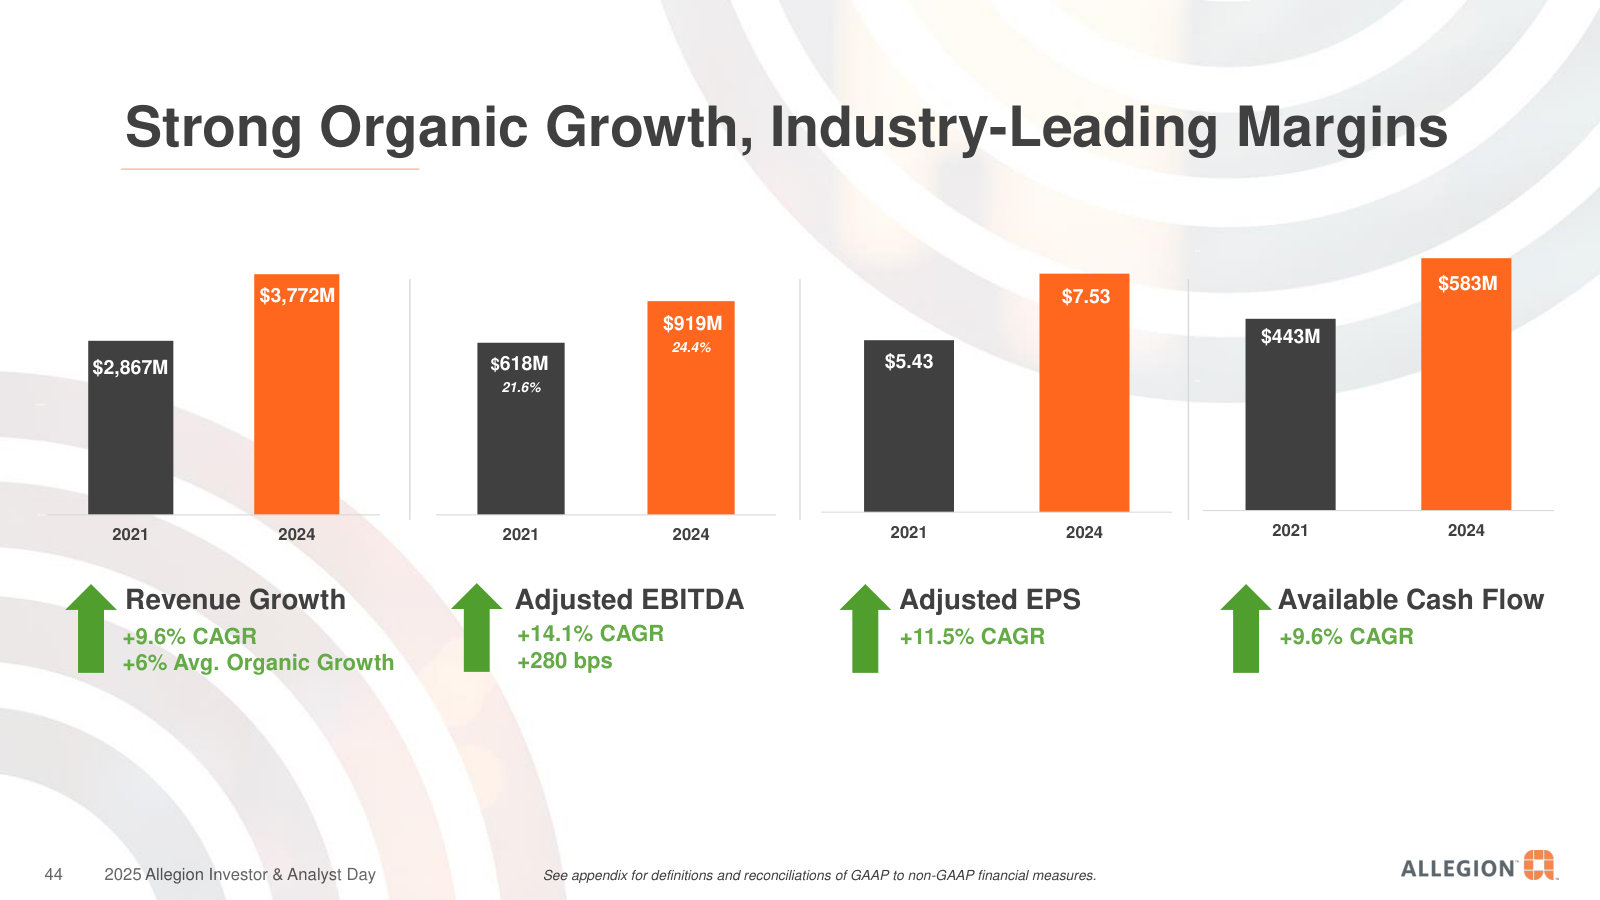
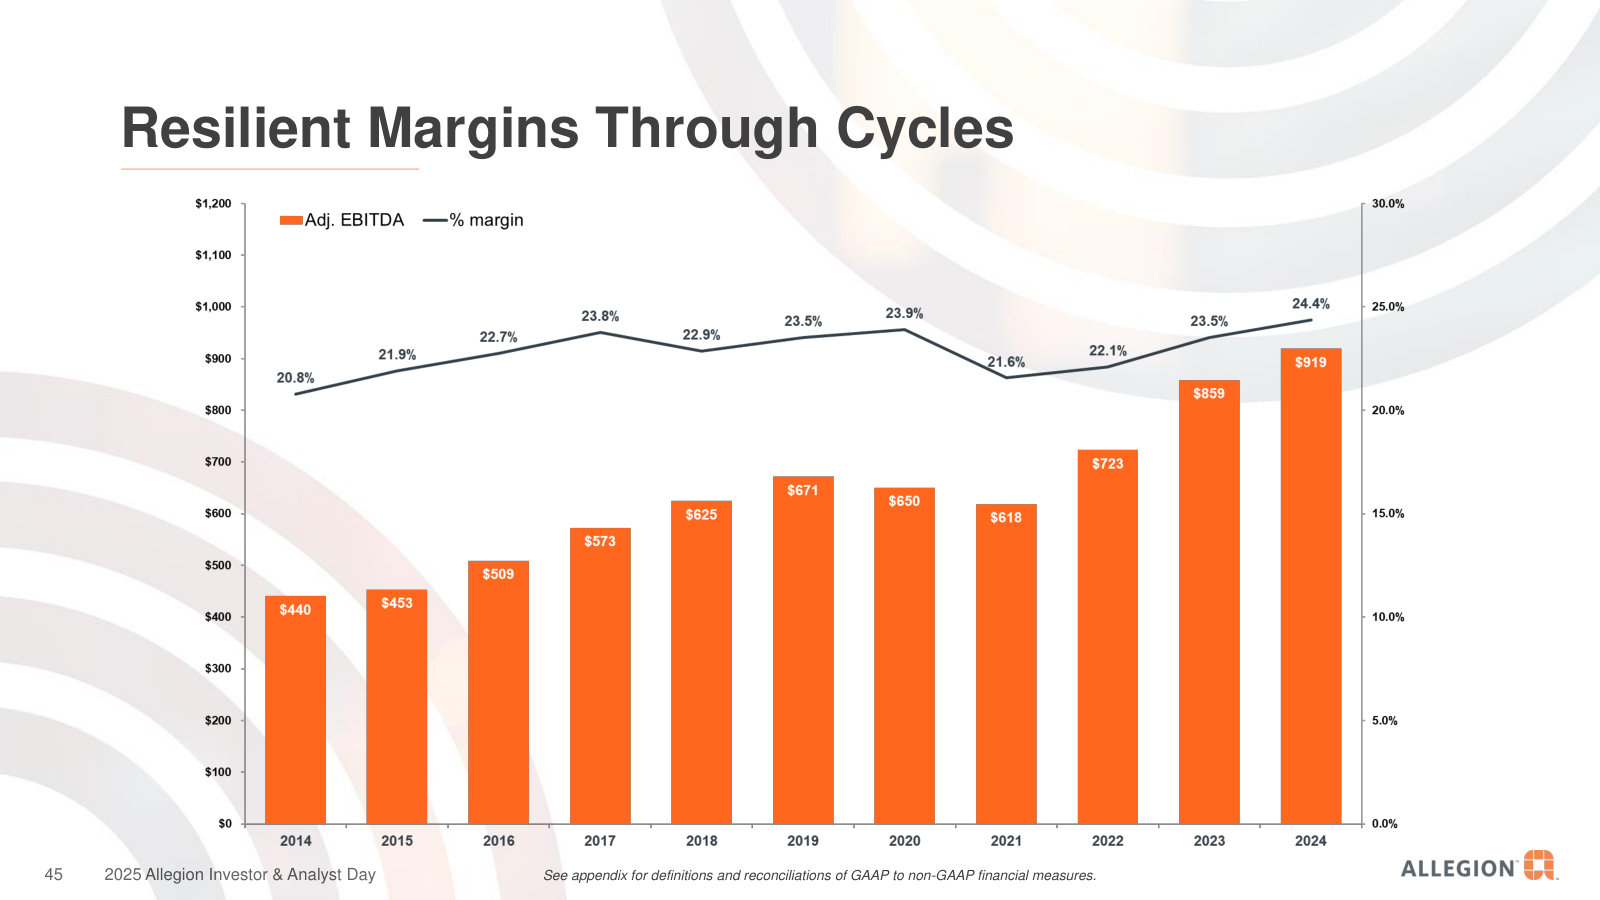
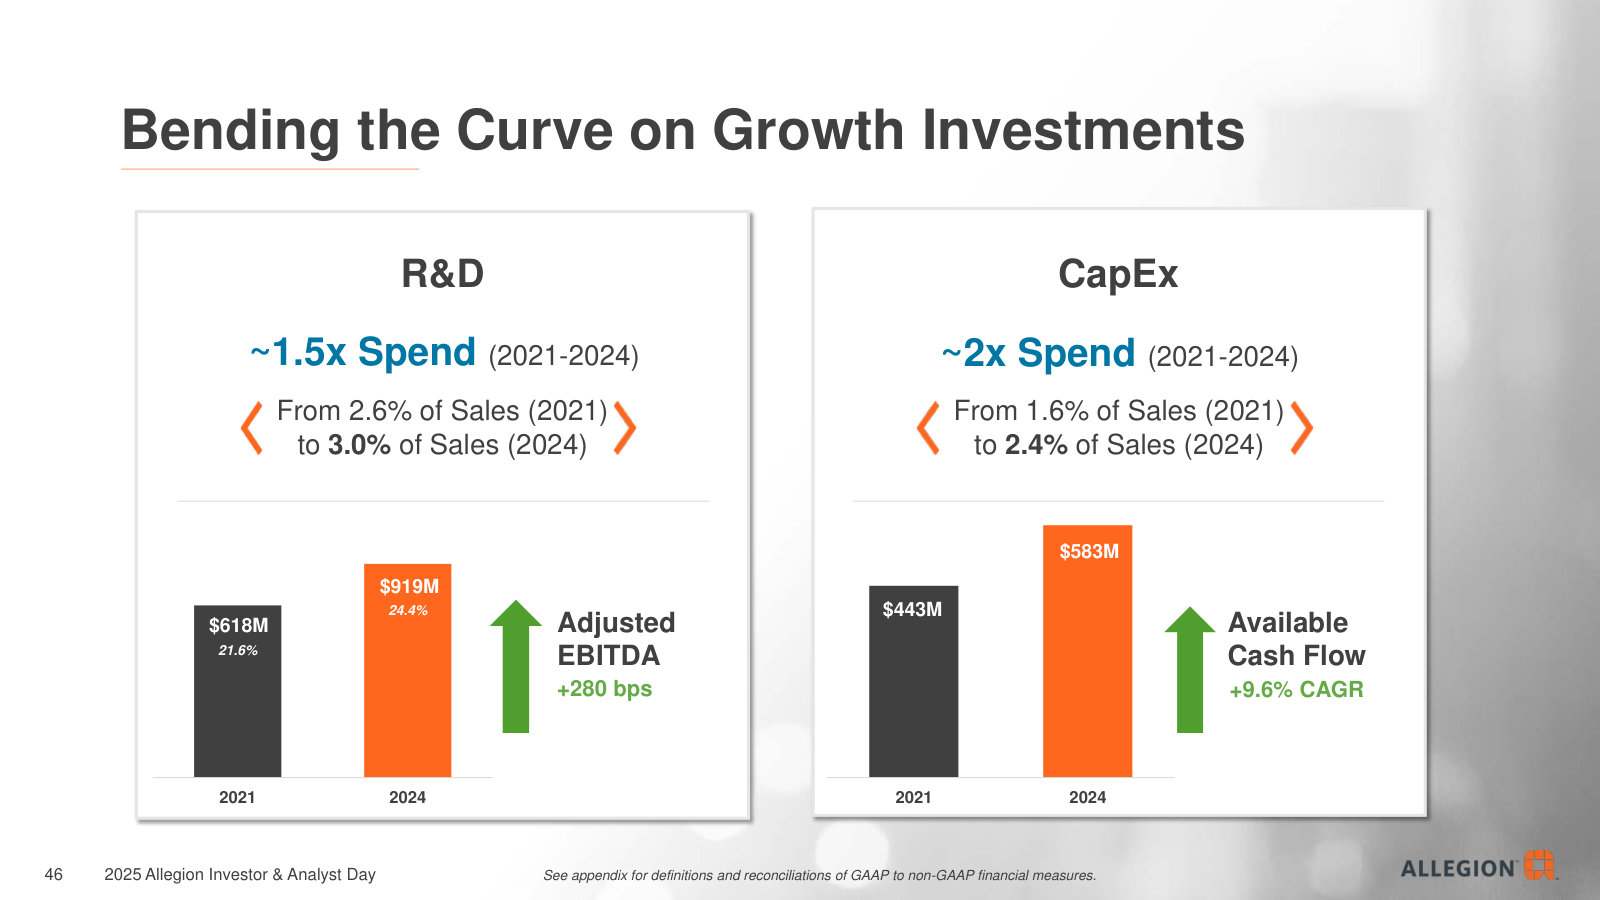
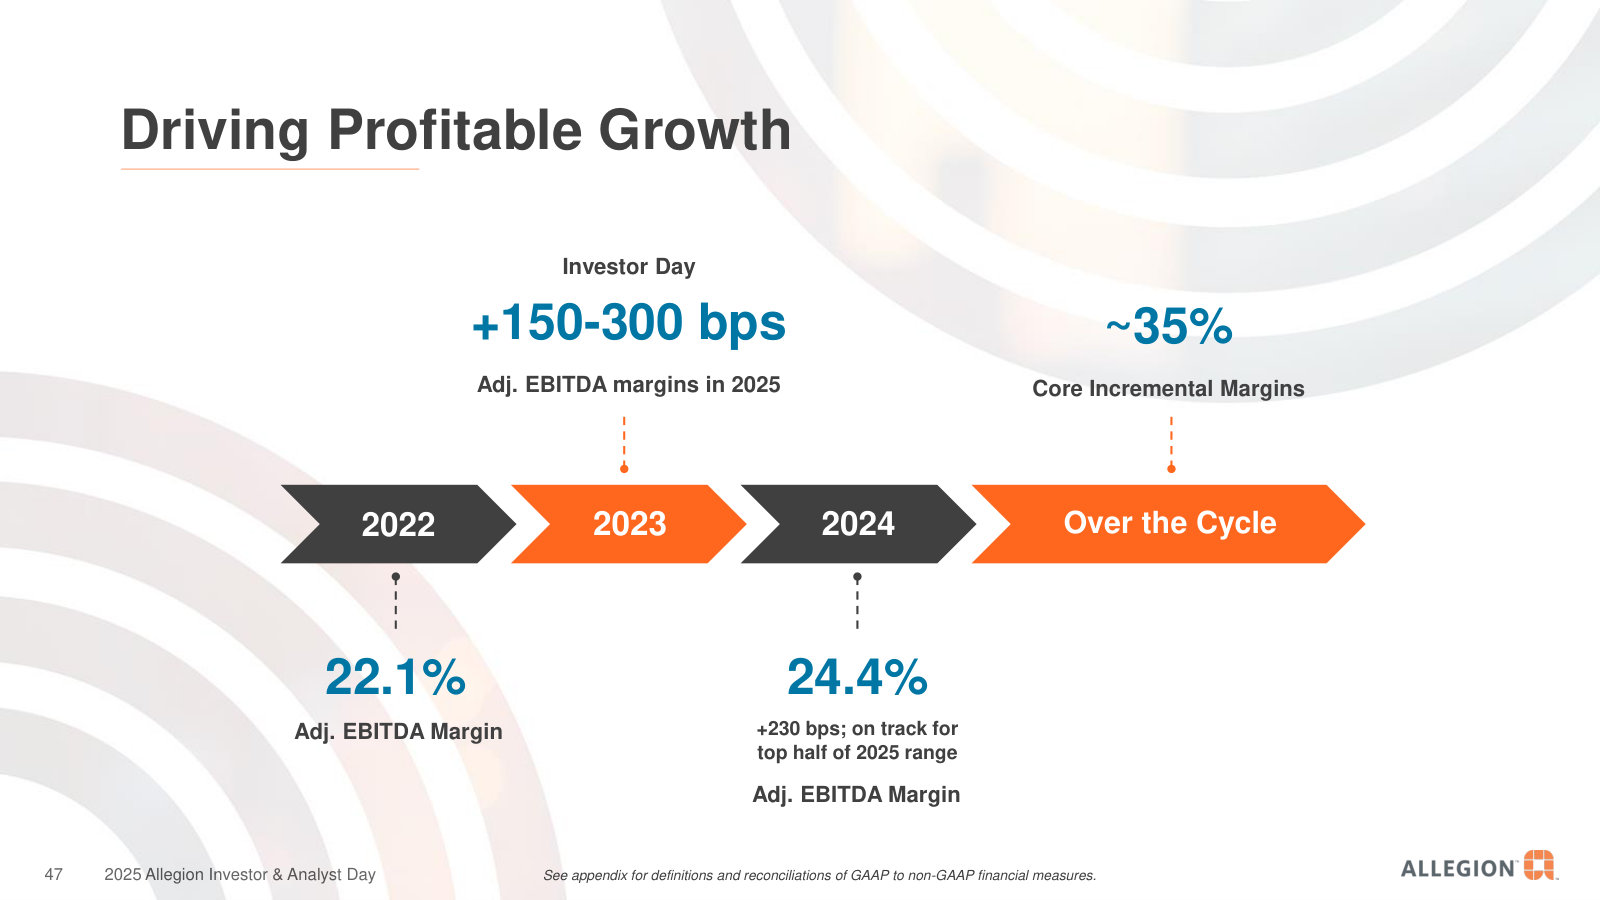
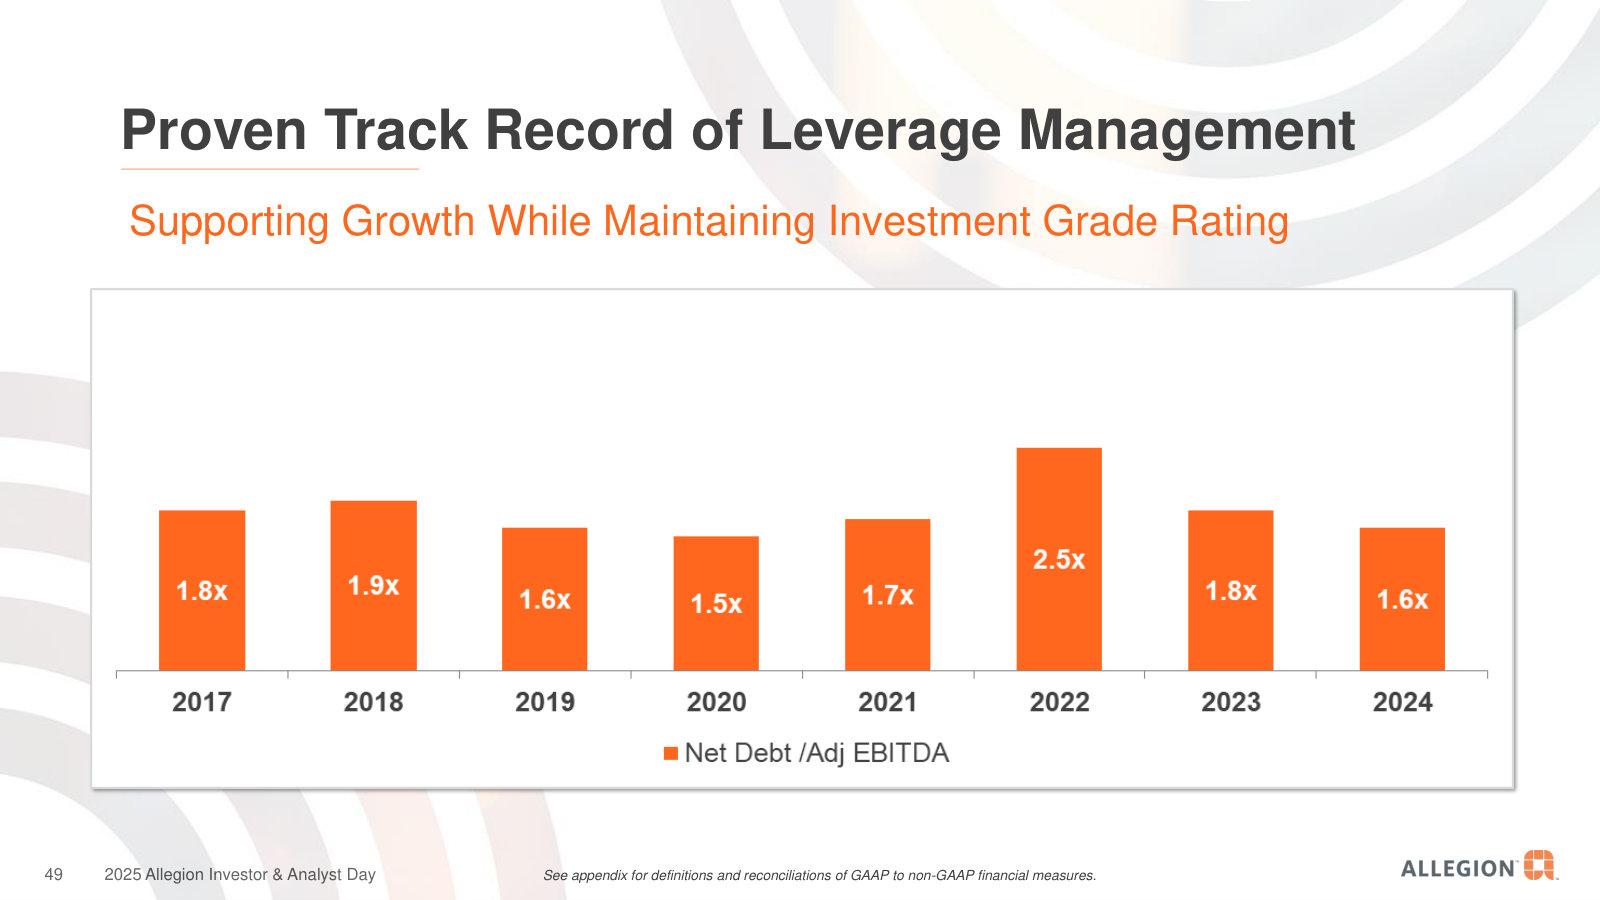
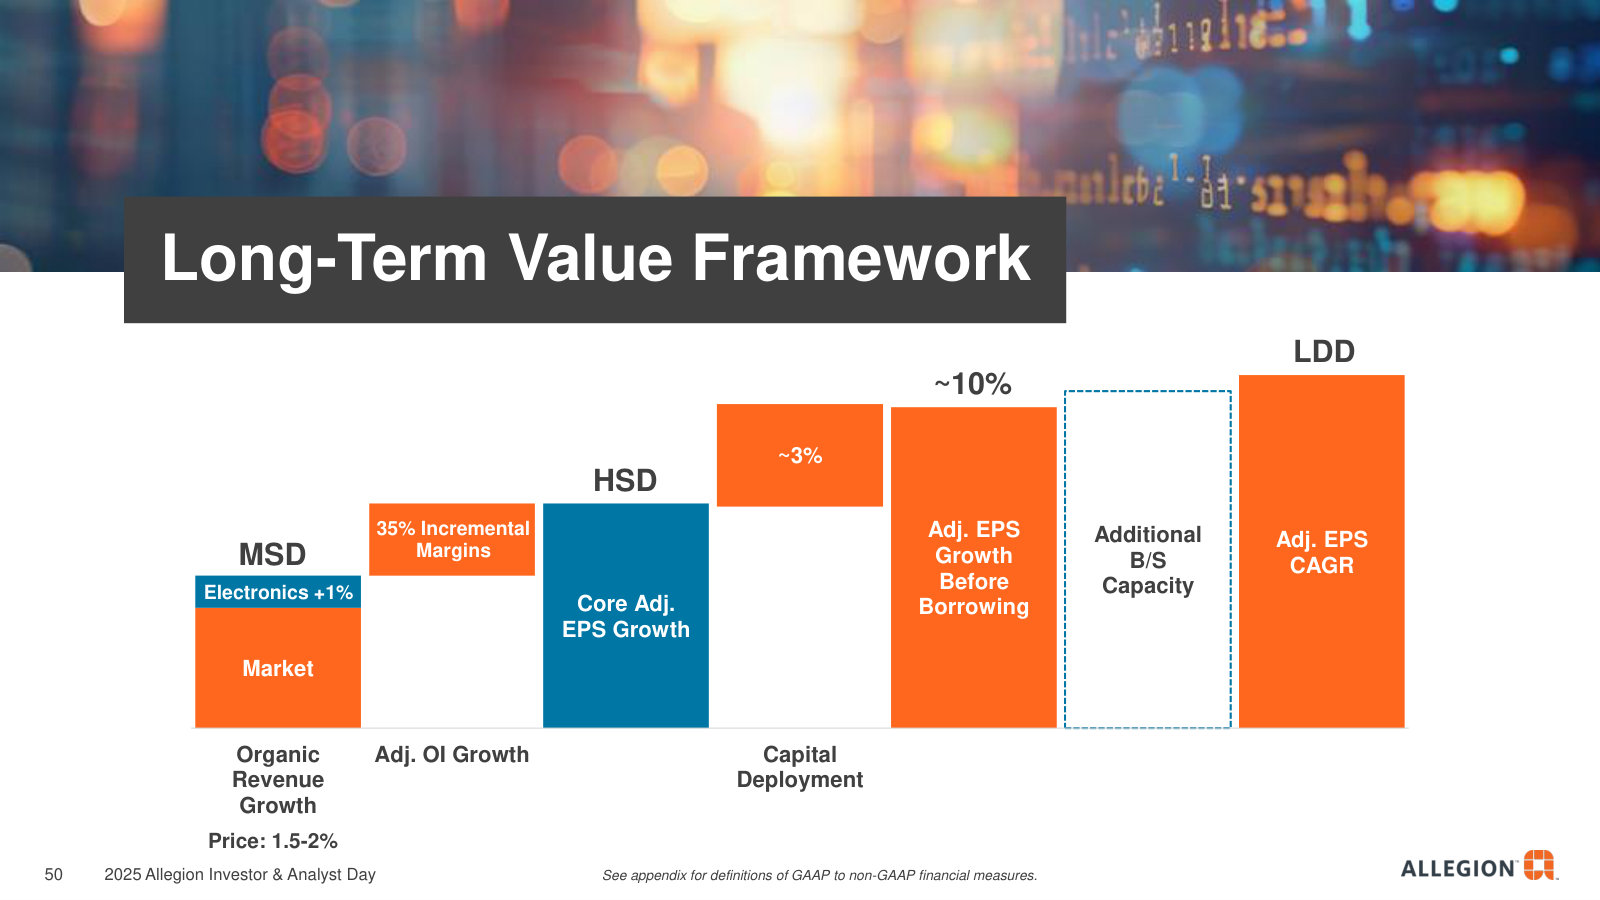
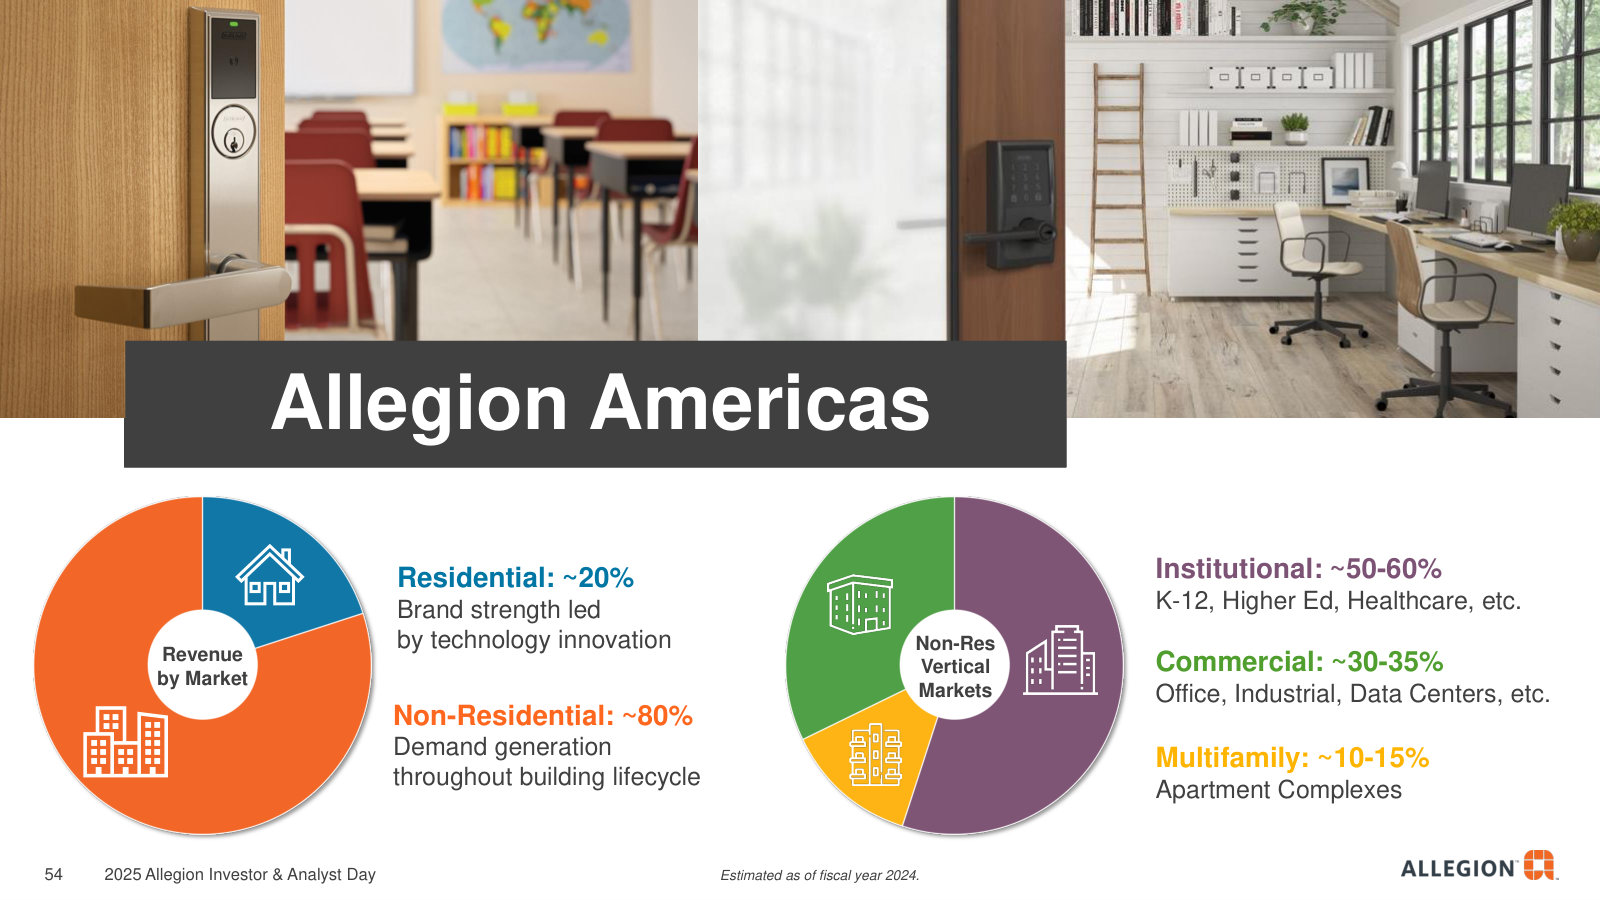
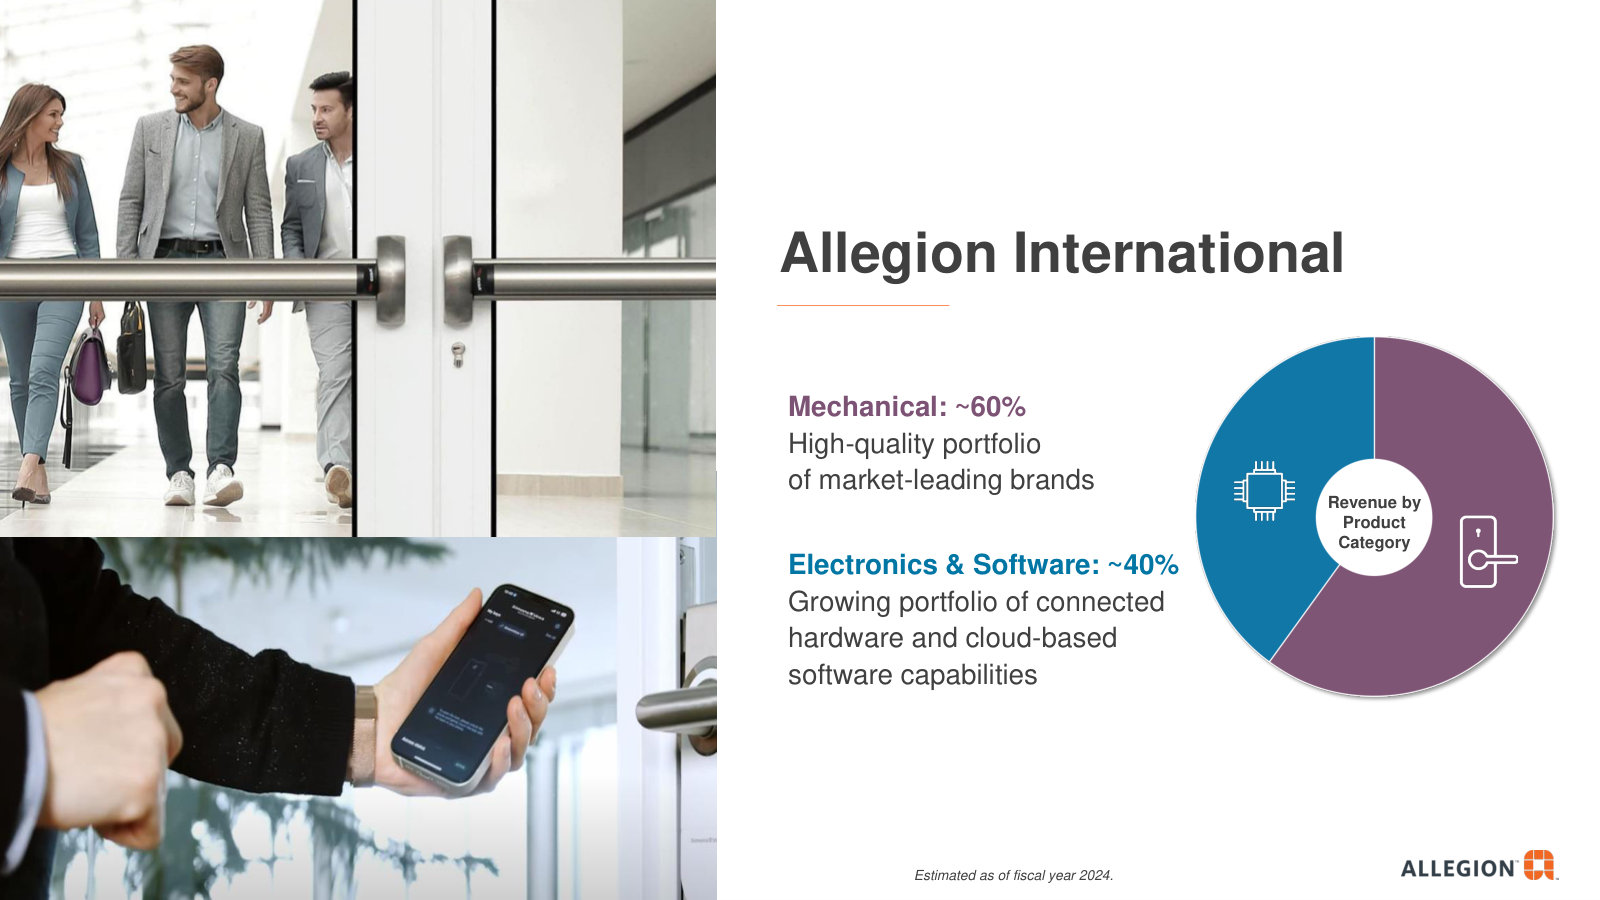
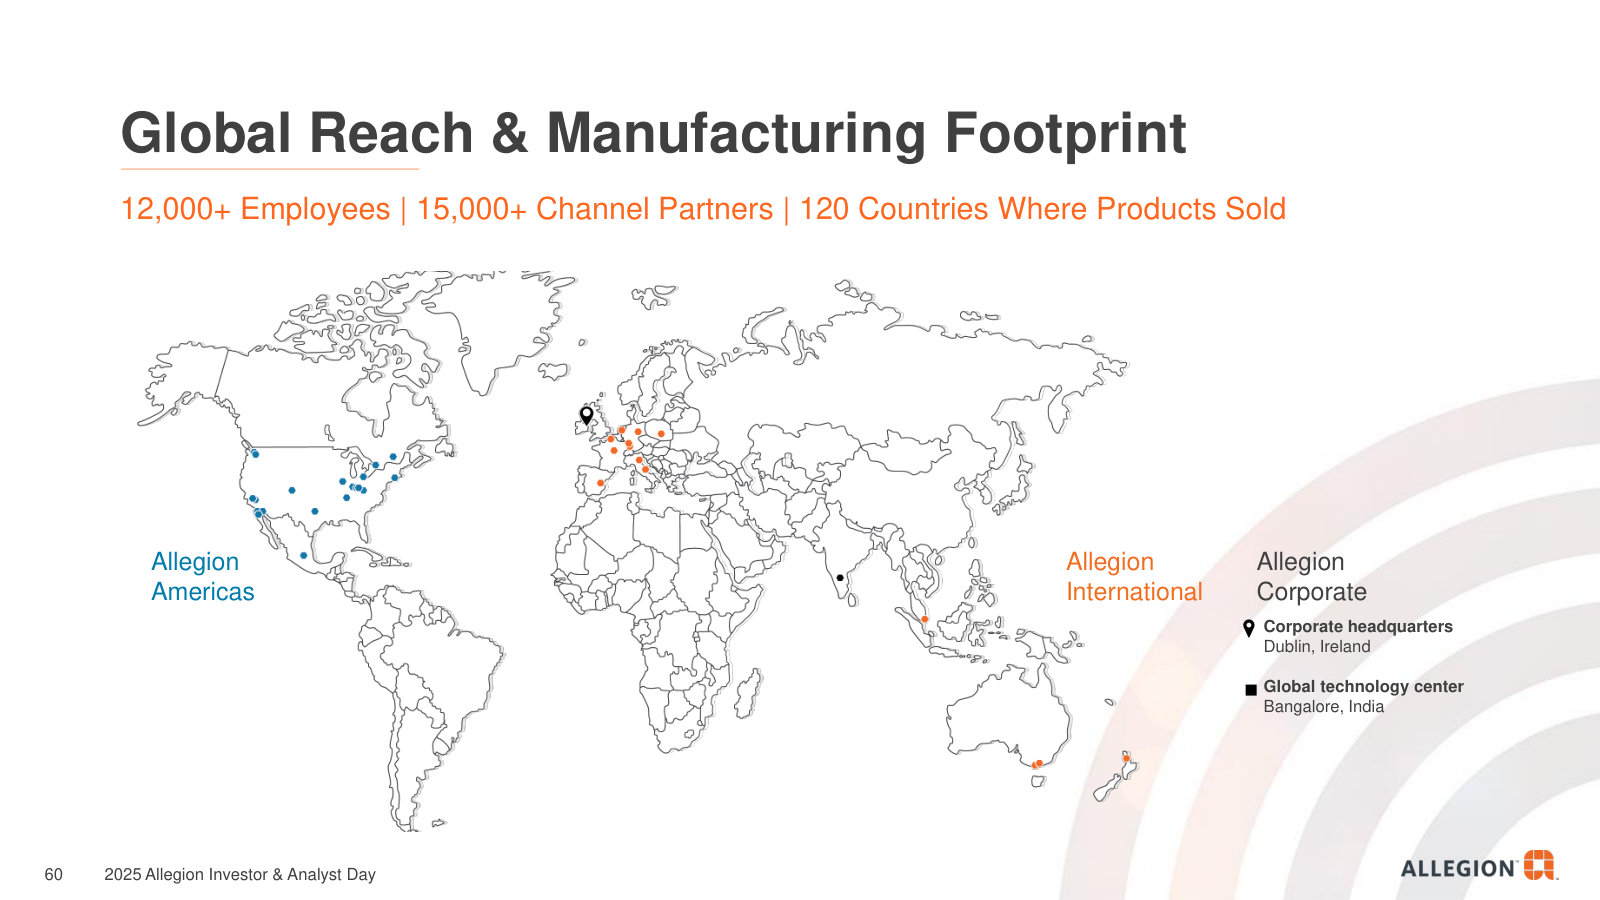
p. 9 — The company in one page: $3.8B revenue at 24.4% EBITDA margin, ~68% mechanical / 25% electronics and ~80% Americas / 20% International. · Open the full presentation →p. 10 — The three markets Allegion plays in — U.S. non-residential, U.S. residential and International — and its stated priority in each. · Open the full presentation →p. 11 — The advantage flywheel: spec-writing front end, diverse local markets, configured-to-order solutions, technology and capital deployment. · Open the full presentation →p. 12 — The four levers behind double-digit adjusted EPS growth over the cycle: organic growth, margin, cash conversion and capital deployment. · Open the full presentation →p. 13 — How growth is built — average organic (price + volume) plus M&A — and why management thinks 7%+ over the cycle is achievable. · Open the full presentation →p. 14 — Where the cash goes: the historical mix (45% M&A, 32% buybacks, 23% dividends) versus the targeted forward split, ~$2B over three years. · Open the full presentation →p. 15 — Allegion's M&A discipline — three priority areas and the criteria a deal must clear, including ROIC above cost of capital. · Open the full presentation →p. 16 — The ~$20B Americas market on one door: locks, electronics, exits/closers, hollow metal and accessories, and how consolidated each is. · Open the full presentation →p. 20 — What makes the model different: a spec-writing front end that pulls product through the channel, plus technology that drives growth. · Open the full presentation →p. 21 — Demand generation across the building lifecycle — the design, construct and own stakeholders Allegion sells to at each stage. · Open the full presentation →p. 22 — The specification moat up close — architects and consultants design Allegion into projects via Revit/Overtur before bidding begins. · Open the full presentation →p. 25 — Why content per building matters — institutional buildings carry far more security content than commercial or multifamily. · Open the full presentation →p. 35 — The electronics economics: ~30% of revenue, high-single-digit growth over the cycle, and 2–2.5x the price of mechanical at similar margins. · Open the full presentation →p. 36 — Where electronics adoption is growing — K-12, higher ed, multifamily and enterprise — and what Allegion sells into each. · Open the full presentation →p. 37 — The multifamily runway: ~25M U.S. units, mostly lower-penetrated Class B/C, and the owner/tenant ROI that drives electronic upgrades. · Open the full presentation →p. 40 — Platforming payoff — reusing common electronics, software and hardware cut development time ~45% and freed ~225 person-months. · Open the full presentation →p. 41 — A decade of electronics launches, from Schlage NDE (2014) to XE360 (2025) — the innovation cadence behind the outgrowth. · Open the full presentation →p. 44 — The four-year scorecard, 2021–2024: revenue, adjusted EBITDA, adjusted EPS and cash flow, with the CAGR behind each. · Open the full presentation →p. 45 — Adjusted EBITDA and margin every year, 2014–2024 — the case for margins that hold and expand through the cycle. · Open the full presentation →p. 46 — Investing while expanding margin — R&D up ~1.5x and capex up ~2x from 2021 to 2024, funded by rising profitability. · Open the full presentation →p. 47 — The margin trajectory, 22.1% (2022) to 24.4% (2024), and the ~35% core incremental margins management expects over the cycle. · Open the full presentation →p. 49 — Net debt / EBITDA since 2017, held around 1.5–2.5x — the leverage discipline that keeps the investment-grade rating. · Open the full presentation →p. 50 — The whole thesis as one bridge: mid-single-digit organic growth compounding to low-double-digit adjusted EPS via margin and capital. · Open the full presentation →p. 54 — Inside Allegion Americas — ~80% non-residential, and how the non-res mix splits across institutional, commercial and multifamily. · Open the full presentation →p. 55 — Inside Allegion International — ~60% mechanical, ~40% electronics and software, across market-leading regional brands. · Open the full presentation →p. 60 — The global footprint: 12,000+ employees, 15,000+ channel partners, products in 120 countries, HQ in Dublin, tech center in Bangalore. · Open the full presentation →
The latest quarterly deck — current revenue, segment results and full-year guidance, showing how the investor-day model is tracking now. · Open the full document →
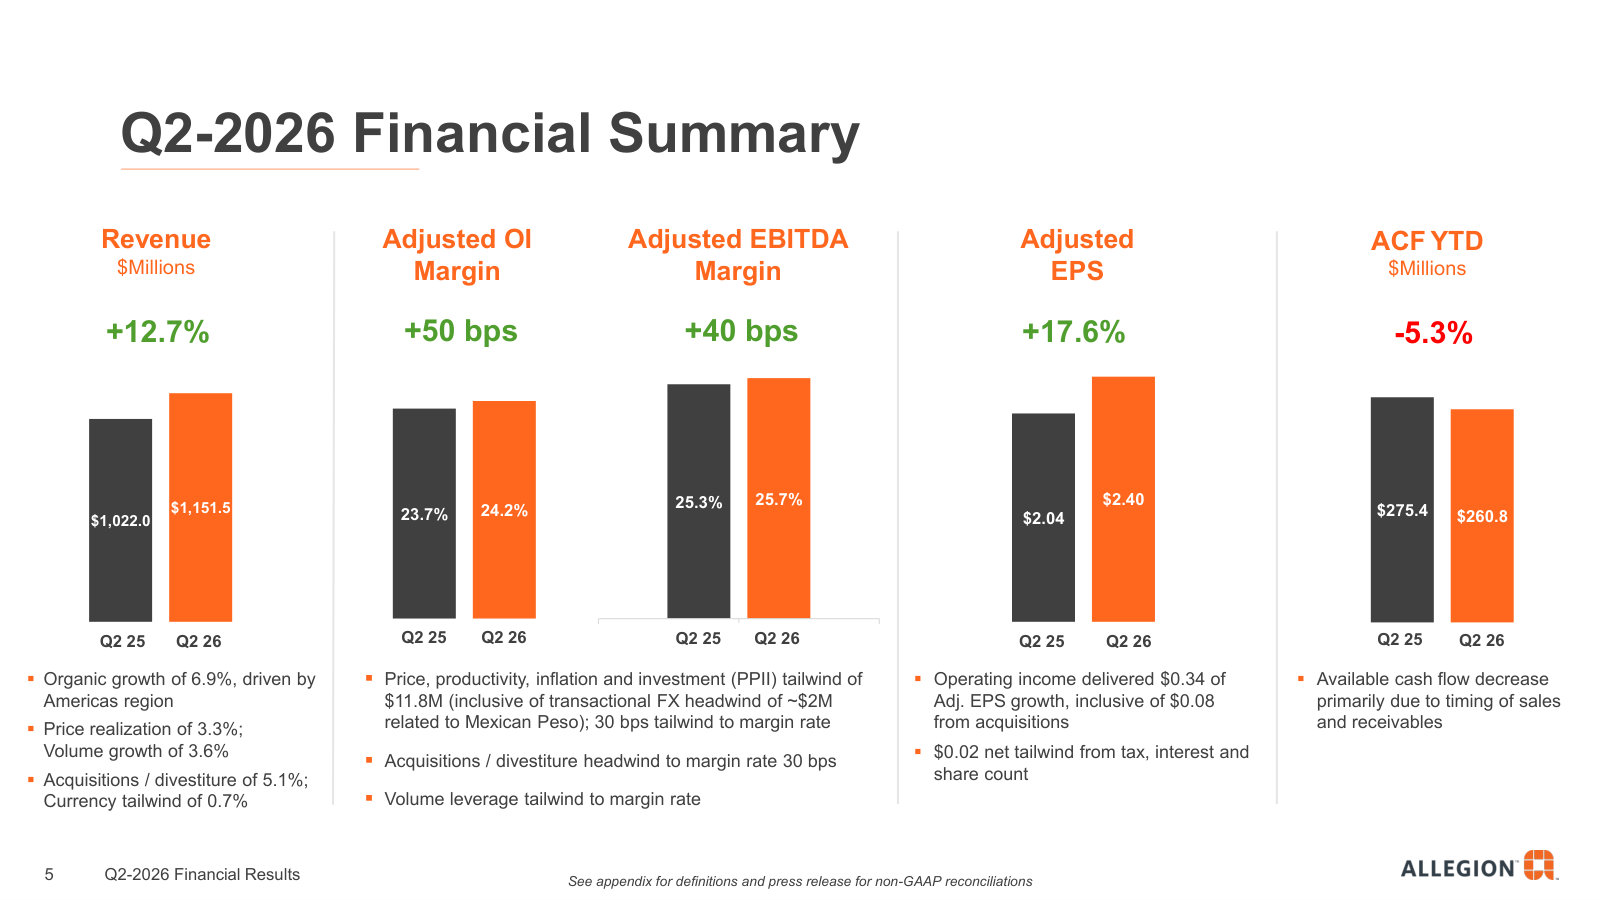
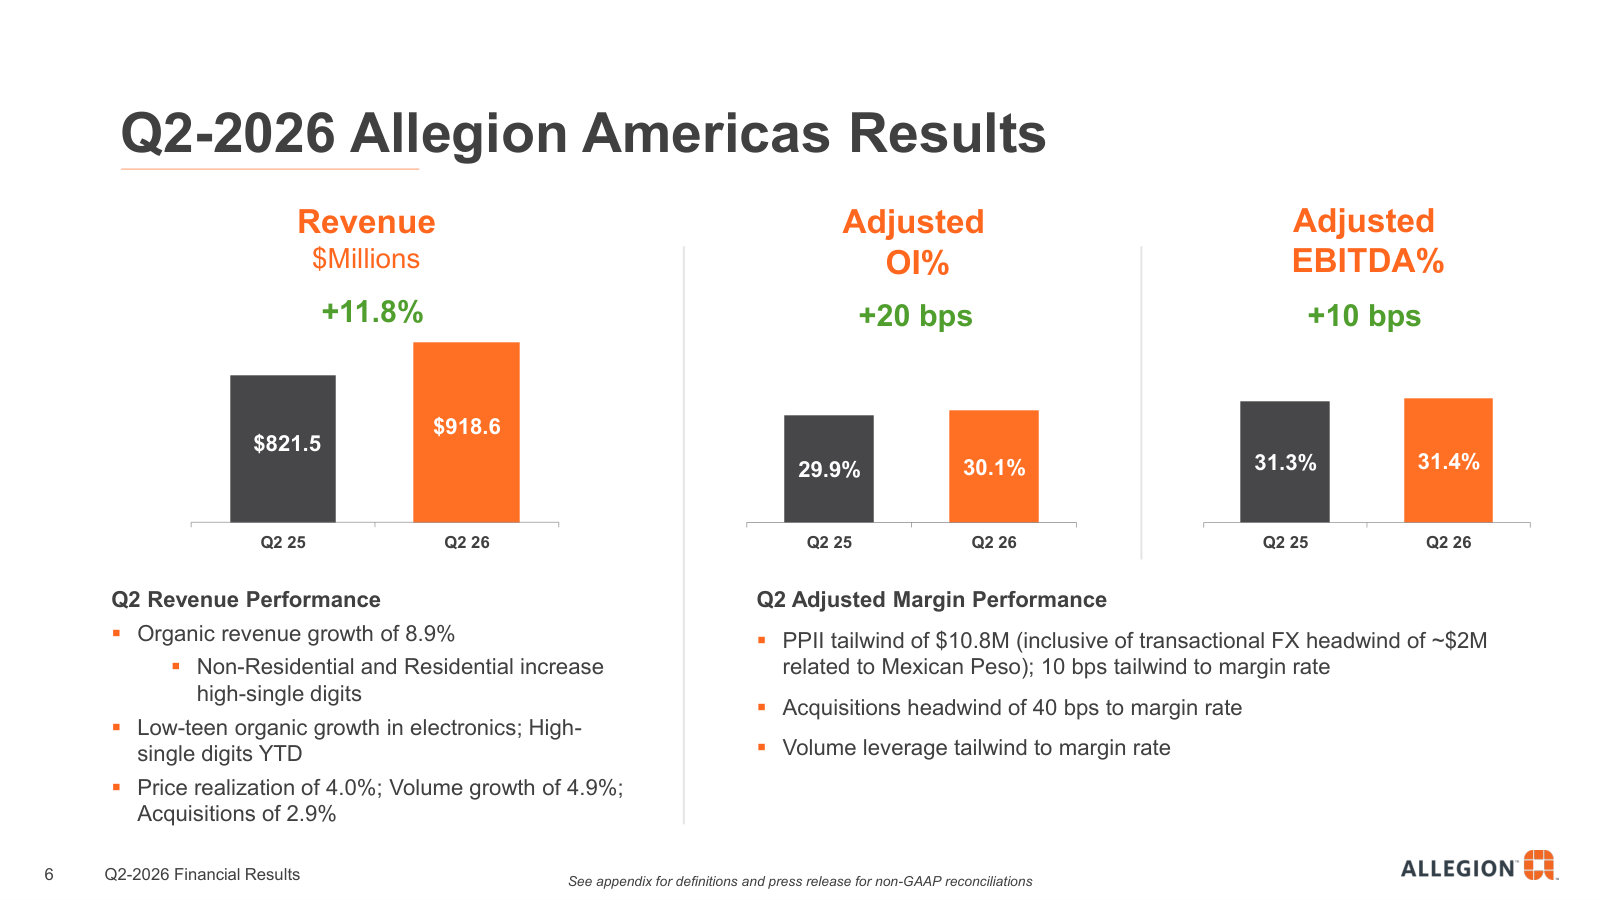
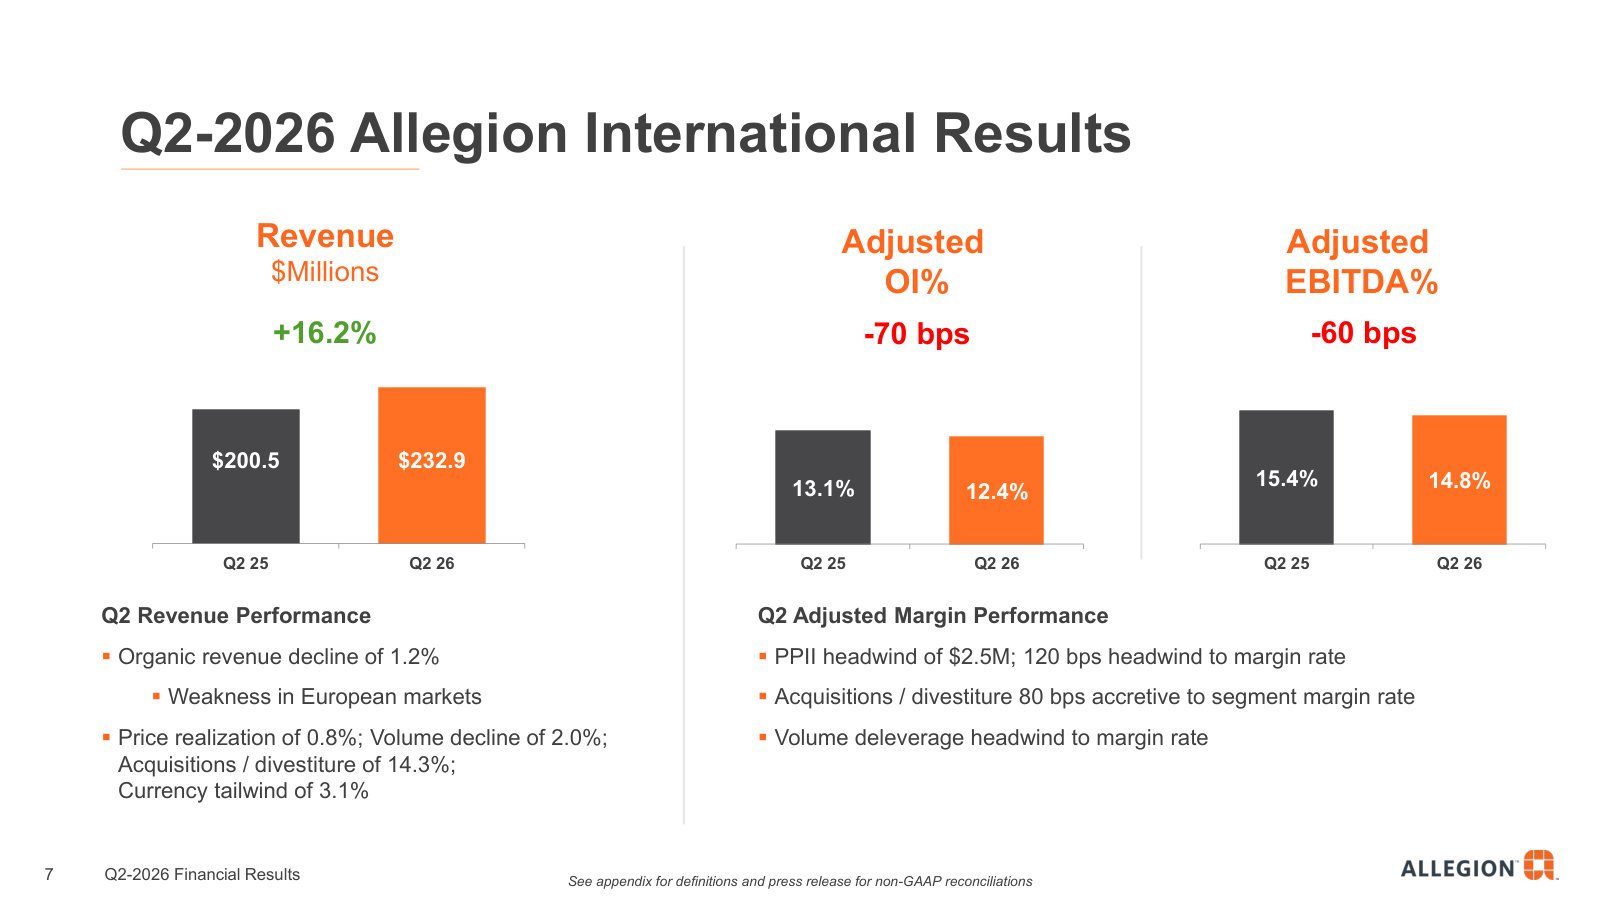
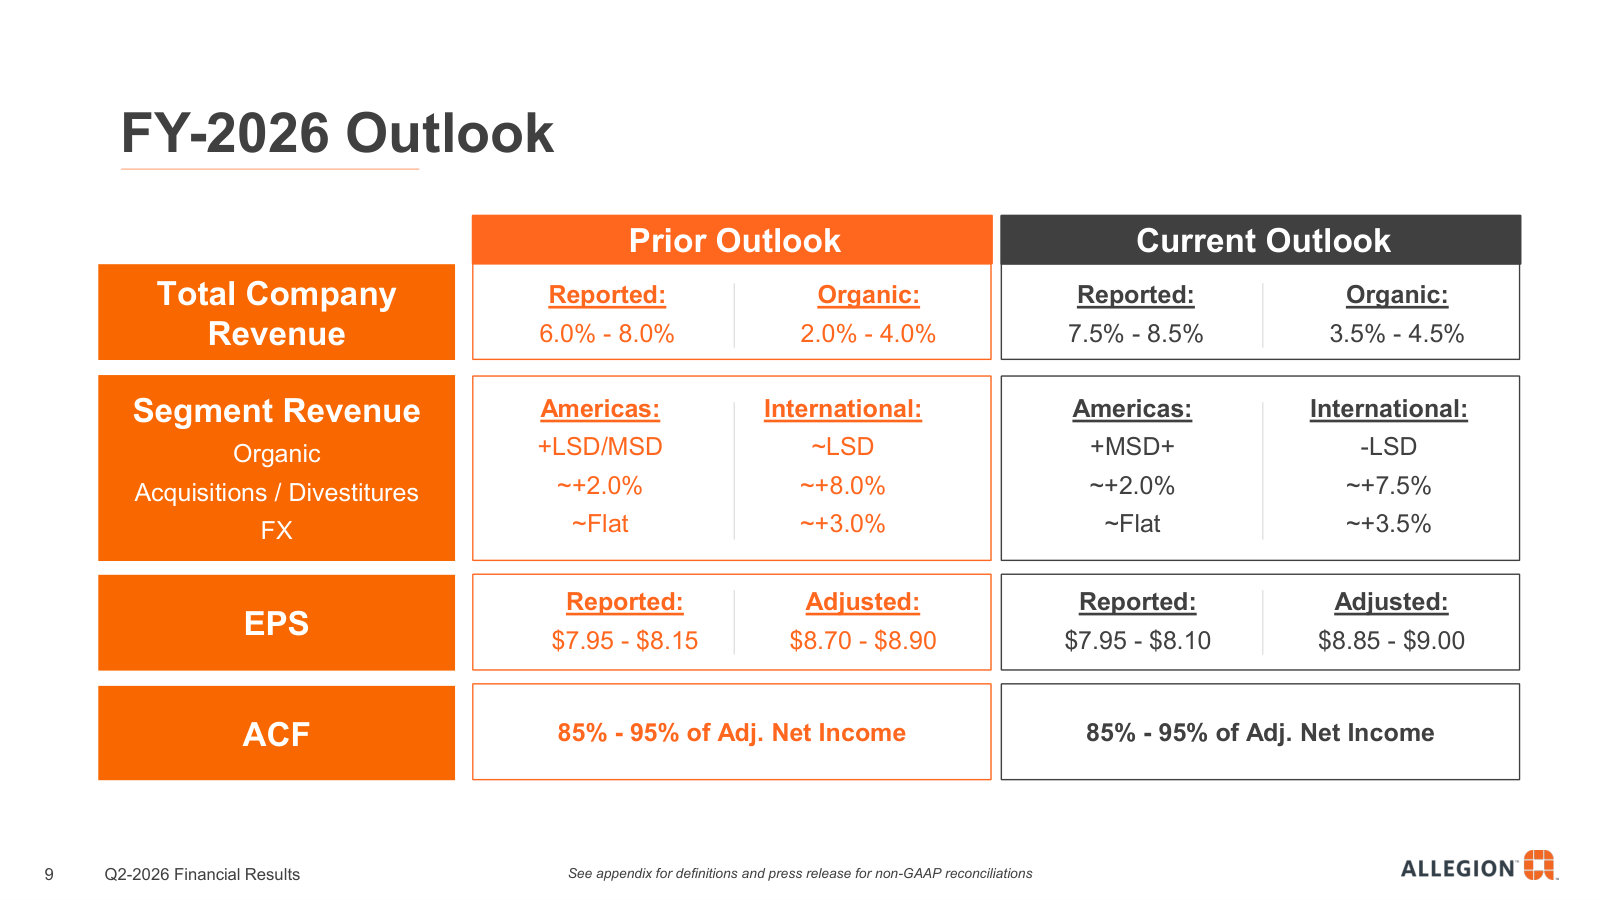
p. 5 — Q2-2026 at a glance: $1.15B revenue up 12.7%, adjusted EBITDA margin 25.7% and adjusted EPS up 17.6% — the current run-rate. · Open the full presentation →p. 6 — Allegion Americas now — $918.6M revenue up 11.8% at ~30% adjusted OI margin, with 8.9% organic growth led by electronics. · Open the full presentation →p. 7 — Allegion International now — $232.9M revenue up 16.2% on acquisitions but down 1.2% organically on European weakness. · Open the full presentation →p. 9 — Full-year 2026 guidance, raised: 3.5–4.5% organic growth and $8.85–9.00 adjusted EPS, broken out by segment. · Open the full presentation →
Q4 / Full-Year 2025 Earnings Call Presentation — Q4 / FY 2025 · 19 pages · Full-year 2025 results and the 2026 end-market outlook by segment — the baseline the current year builds on. · Open →