Annual Reports
Allegion plc's annual reports contain management's most considered account of the business. These are the sections, passages and visual pages worth opening in the originals preserved in Sources.
Allegion plc — FY2025 Annual Report (Form 10-K) — FY2025
The latest 10-K: the security-hardware business, its 40+ brands, what drove 2025 results, and the two-segment split. · Open the full document →
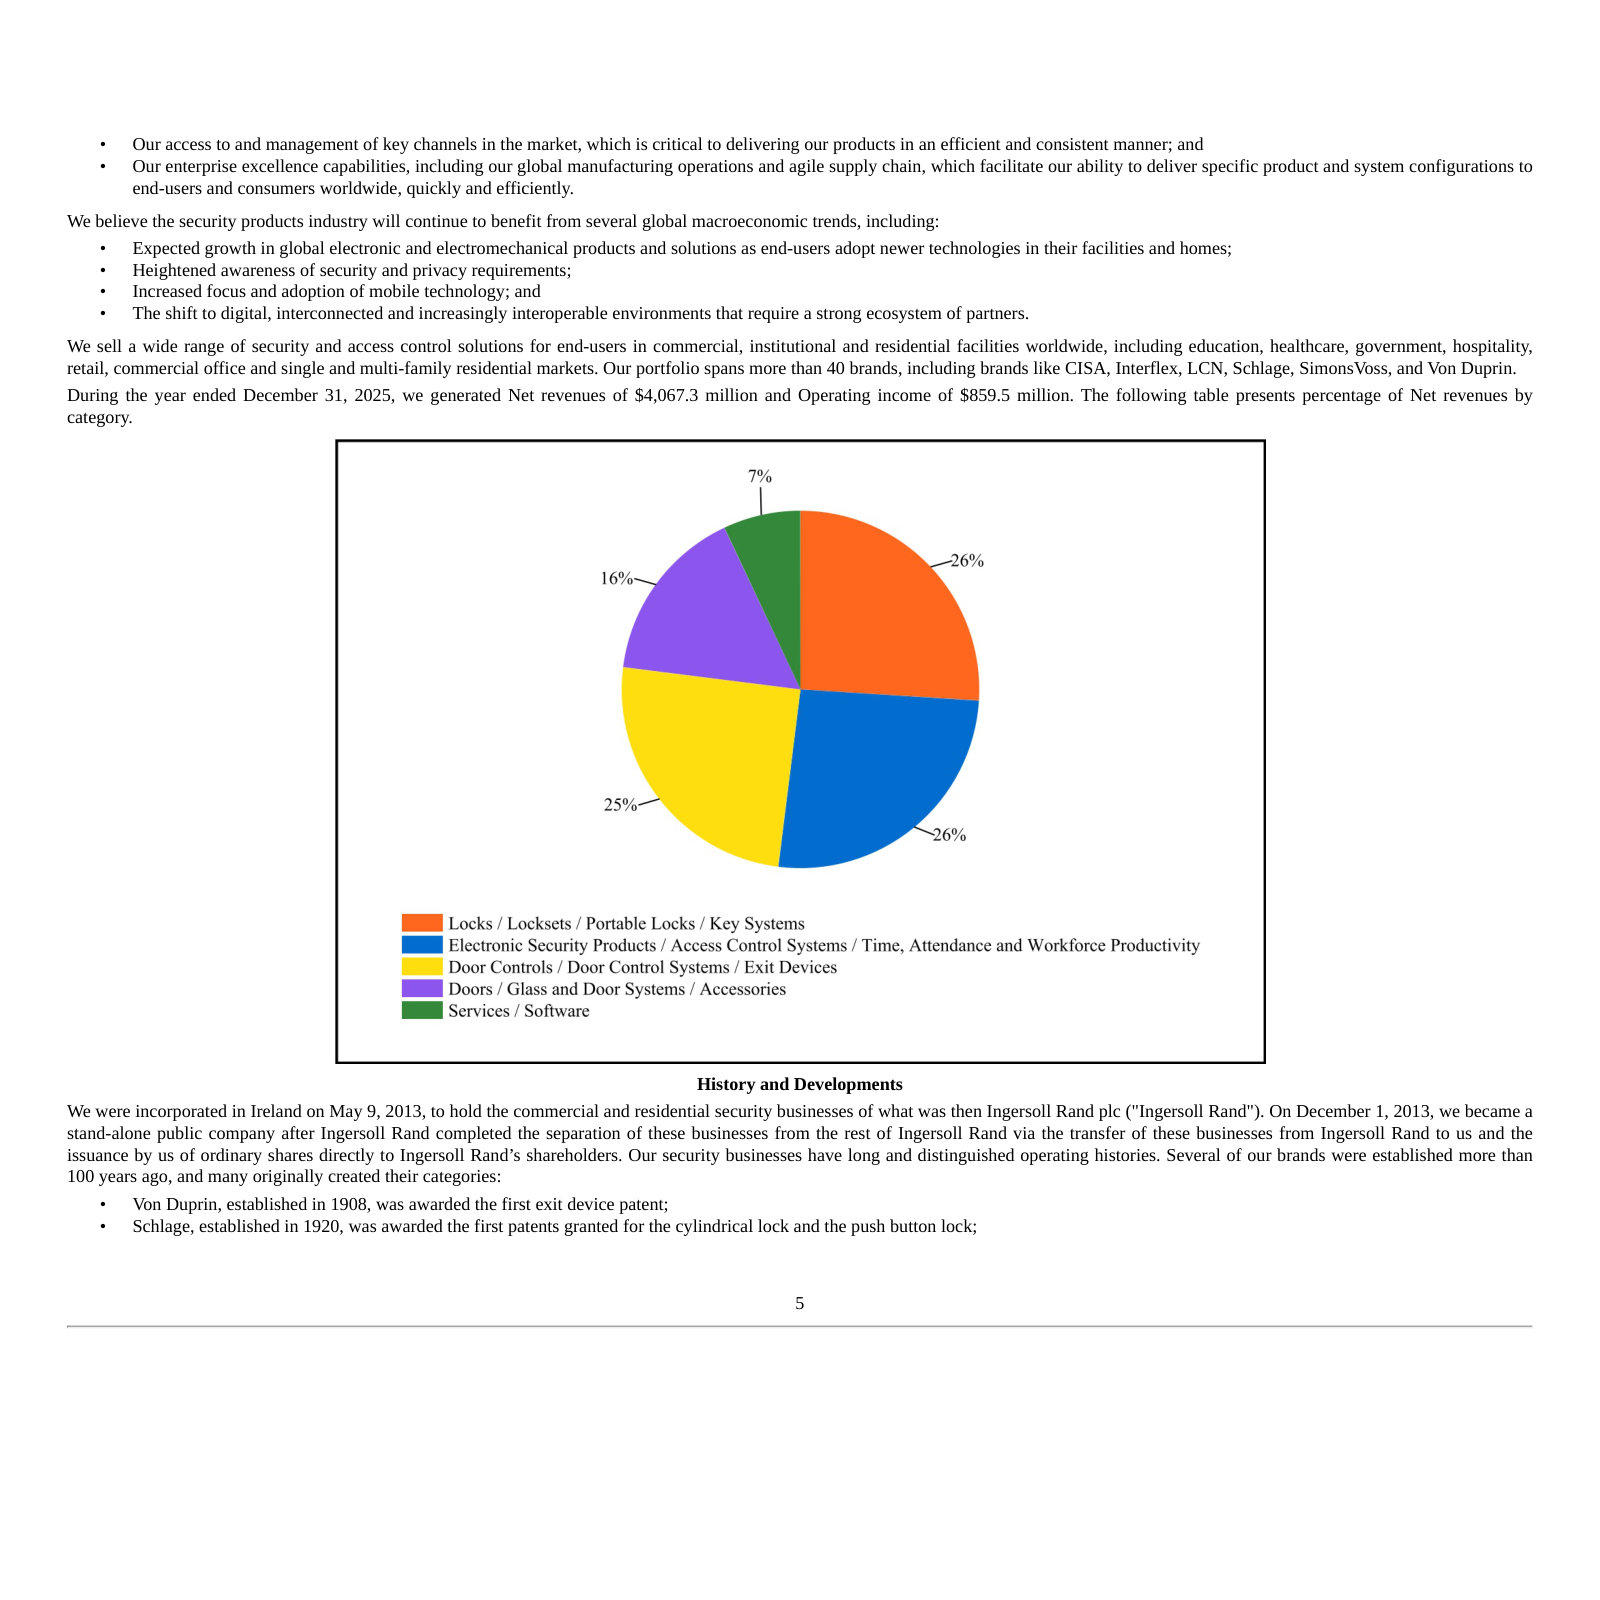
Item 1. Business — p. 6 · Read the full section →
How Allegion makes money — door hardware and access control sold through distribution under 40+ brands like Schlage and Von Duprin.
Management's own description of the business and its market-leading brand portfolio.
Allegion plc ("Allegion," "we," "us" or "the Company") is a leading global provider of security products and solutions that keep people and assets safe and secure in the places they live, learn, work and connect. […] We offer an extensive and versatile portfolio of security and access control products and solutions across a range of market-leading brands. Our experts around the world deliver high-quality hardware, software, services and systems, and we use our deep expertise to serve as trusted partners to end-users who seek customized solutions to their security needs
p. 6 · Read in context →
Item 1A. Risk Factors — p. 14 · Read the full section →
The two risks most specific to this business: construction-cycle demand and tariff exposure on Mexico-heavy sourcing.
Demand rides the institutional, commercial and residential construction and remodeling cycle.
Our business performance is impacted by the strength of the institutional, commercial and residential construction and remodeling markets and global macroeconomic factors. […] Demand for our security products and solutions relies on the institutional, commercial, and residential construction and remodeling markets, which are marked by cyclicality based on national, regional and local economic conditions, including consumer confidence and disposable income, corporate and government spending, work-from-home trends, availability of credit and demand for new housing and infrastructure.
p. 14 · Read in context →
Tariffs and global-trade risk: ~20-25% of COGS is sourced from Mexico, offset in 2025 with pricing.
Our global operations subject us to political, economic and regulatory risks, including uncertainty related to the imposition of new or increased tariffs and the global trade environment more generally. […] Throughout 2025, the U.S. government announced tariffs on imports from several countries from which we manufacture and/or import products and components. In 2025, we have offset inflation due to tariffs with pricing actions. We estimate we source approximately 20-25% of Cost of goods sold from Mexico and less than 5% of Cost of goods sold from China.
p. 15 · Read in context →
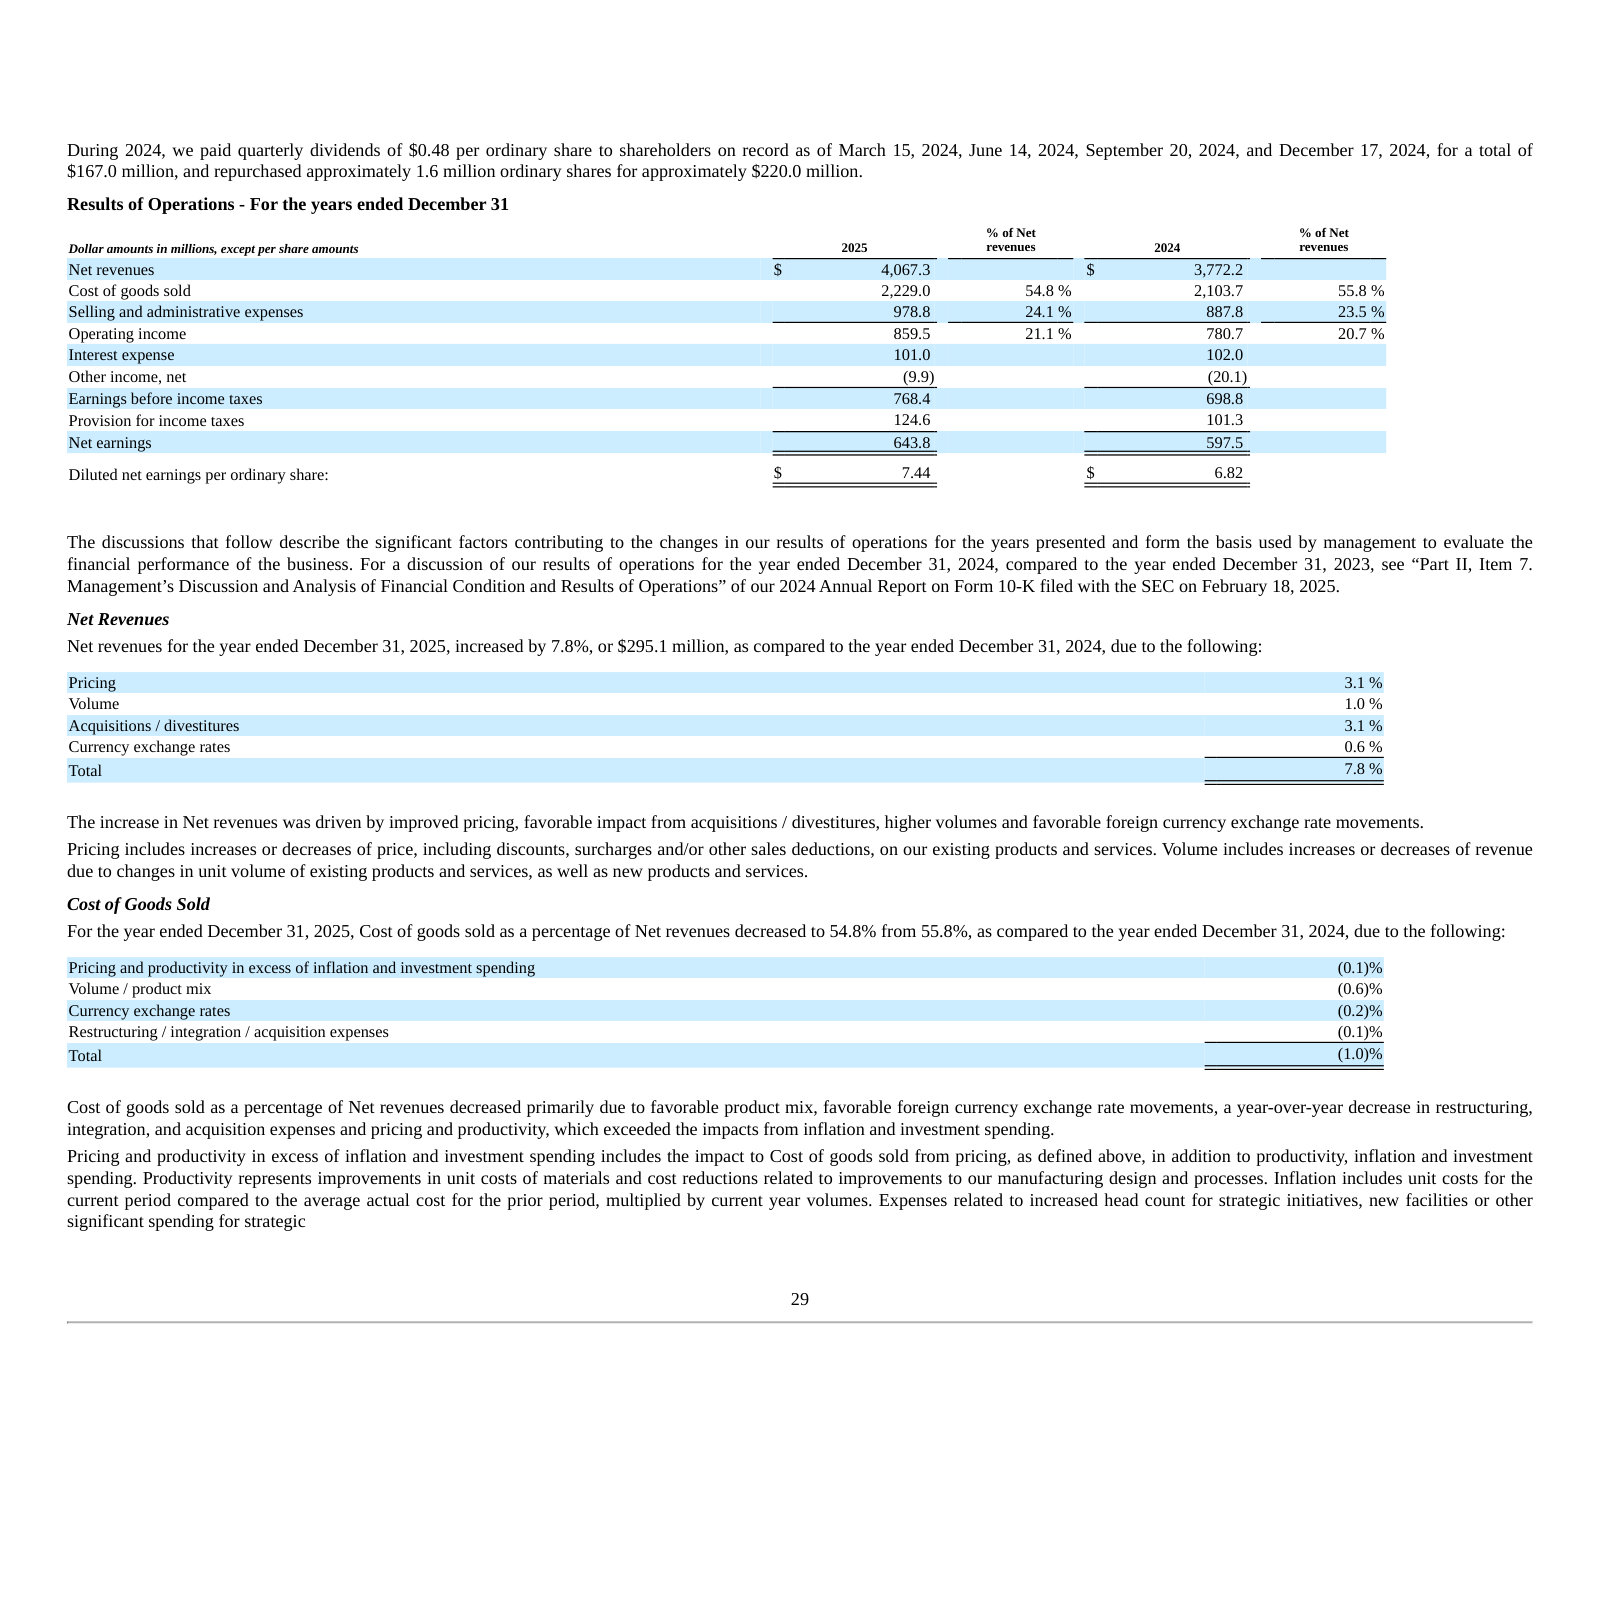
Item 7. Management's Discussion and Analysis — p. 30 · Read the full section →
Where management explains 2025: high-single-digit revenue growth from pricing, volume and acquisitions, plus the tariff response.
2025 trends and outlook — growth drivers, the electronics tailwind, and where COGS is sourced.
In 2025, we delivered high-single digit revenue growth compared to 2024, driven by favorable pricing and volume growth, as well as the impact from acquisitions made during the year. Demand for electronic security products has also remained strong and continues to be a long-term growth driver. […] We estimate we source approximately 20-25% of cost of goods sold ("COGS") from Mexico, less than 5% of COGS from China, and 5-10% of COGS from all other non-US countries.
p. 30 · Read in context →
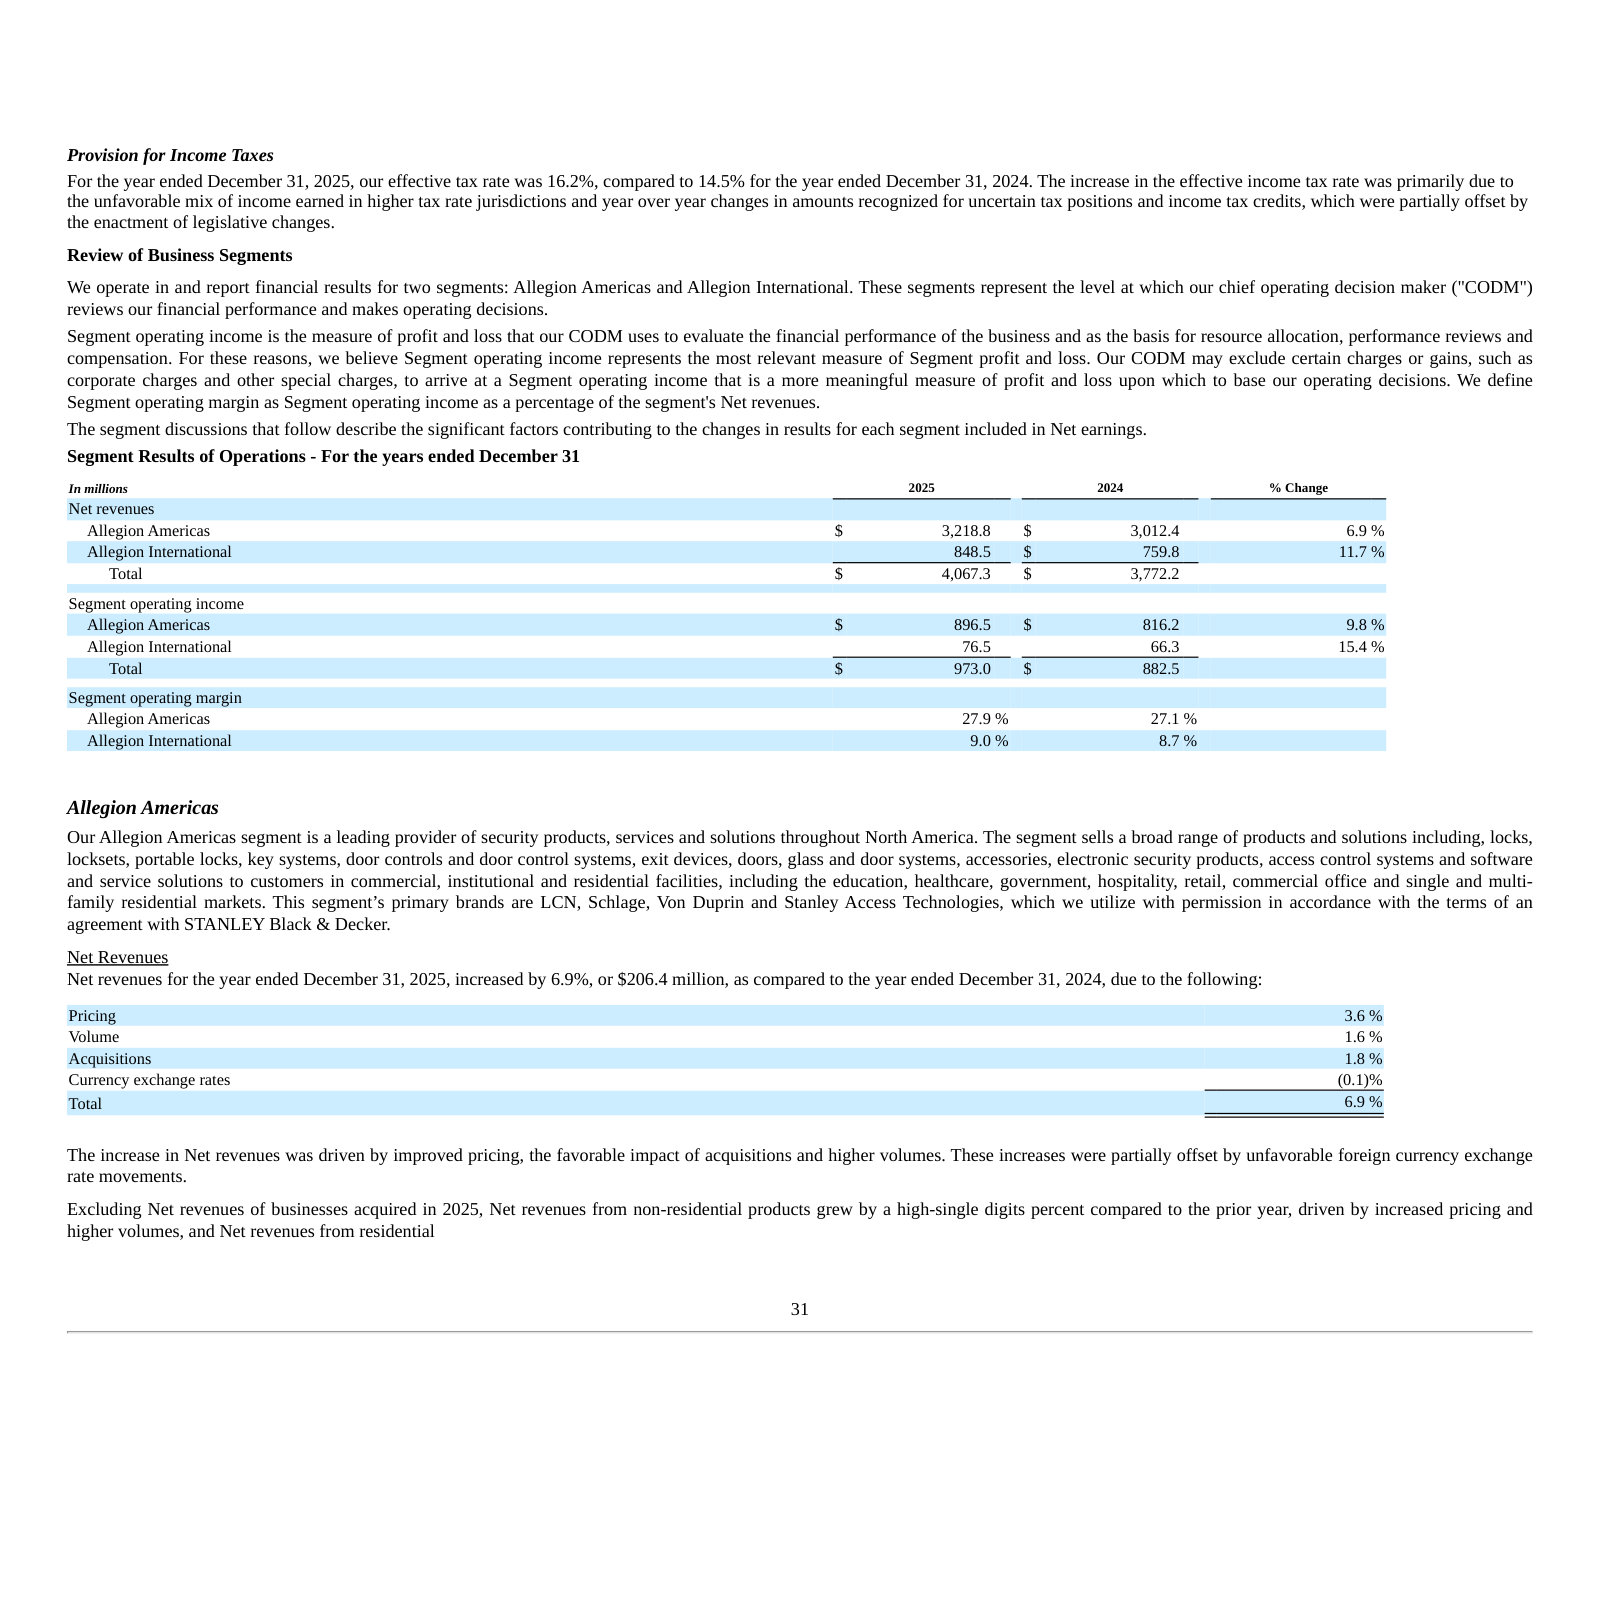
Review of Business Segments — p. 33 · Read the full section →
The two-segment split: Allegion Americas is the ~28%-margin profit engine; International is smaller, lower-margin and scaling via M&A.
Allegion plc — FY2021 Annual Report (Form 10-K) — FY2021
Included for one evolution: the 2021 redefinition that created today's two reportable segments. · Open the full document →
Review of Business Segments — p. 38 · Read the full section →
Documents the move from three segments (Americas, EMEA, Asia Pacific) to today's Allegion Americas and Allegion International.
The January 2021 segment redefinition that combined EMEA and Asia Pacific into Allegion International.
As previously announced, effective January 1, 2021, we combined our previous operations in EMEA and Asia Pacific into a new segment named Allegion International, in addition to renaming our Americas segment "Allegion Americas".
p. 38 · Read in context →
More annual reports
Allegion plc — FY2024 Annual Report (Form 10-K) — FY2024 · 90 pages · Prior-year 10-K; baseline for the 2025 revenue and margin comparisons. · Open →
Allegion plc — FY2023 Annual Report (Form 10-K) — FY2023 · 89 pages · Two-segment reporting; useful for a longer margin and acquisition trend line. · Open →
Allegion plc — FY2022 Annual Report (Form 10-K) — FY2022 · 90 pages · First full year on the two-segment basis after the 2021 redefinition. · Open →